#10: Moving Average Trading Strategy (This Is No Longer a Secret)
Lesson 10
In today's training, I want to share with you a simple moving average trading strategy that you can use to profit in bull and bear markets.
What is a moving average?
Let's get down to basics first before we dive deeper into more advanced concepts.
Average historical prices over a defined period
First and foremost, it takes into account the historical prices and it shows up as a line on your chart. Let me explain to you what this means.
Let’s say the historical price of the market is $1, $2, $3, $4, $5.
The first day the market closed at $1, the second day the market closed at $2, the third day the market closed at $3, the fourth day the market closed at $4, and the fifth day the market closed at $5.
Assuming you used a 5-period moving average, how would the moving average look like on your chart?
So you’ll calculate this total value that you have over here:
$1 + $2 + $3 + $4 + $5 = $15
Then you divide it by 5 periods because there are 5 trading days over here. Then your 5- period MA on this fifth day you’re doing the calculation is equal to $3 with a little dot on the chart.
Let’s say on the sixth day, the market closes at $6. You won't be taking $1, $2, $3, $4, $5, $6 to calculate. What you'll do is to take:
$2 + $3 + $4 + $5 + $6 = $20
Since $6 is the latest closing price, you use only the price from day 2 to day 6 because you are using a 5-period moving average.
Remember, the moving average will average out the past prices. So you’ll divide the total by the number of days:
$20 / 5 = $4
You’ll get $4 as the value of the 5-period moving average on the sixth day.
As the prices trade higher into the future, you are connecting the dots and they would get higher and higher. That's how you get a moving average on your chart.
If the future prices go down lower, your moving average starts to slope down, lower and lower. That’s how a moving average works, that’s the concept behind it.
So a moving average, in essence, is a trend following indicator.
When not to use a moving average?
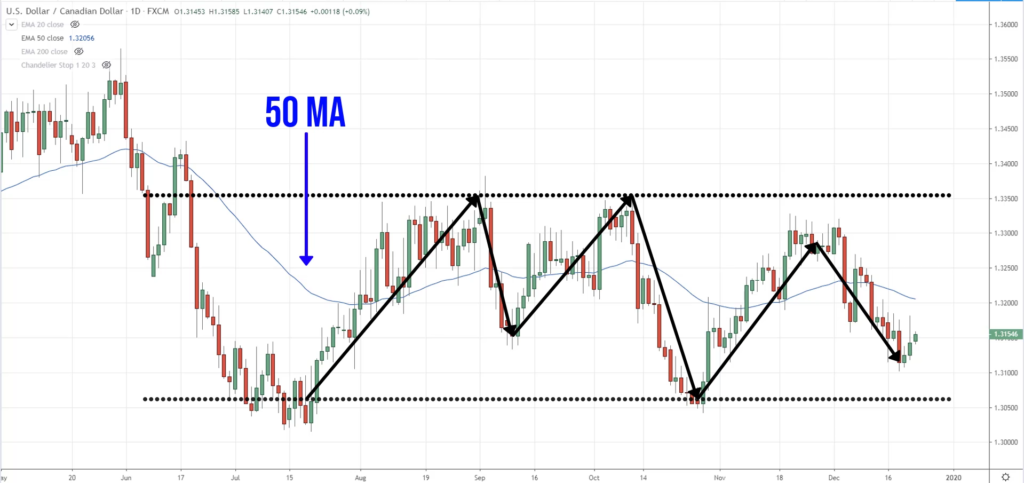
You don't want to use moving average in a range market because this is where you get chopped up and down. For example, you can see this market is in a range:
If you apply a 50-period moving average, you can see the price going up and down.
You’ll just get chopped up and down if you were to use the moving average to time your entry or to trade with the trend, etc. It wouldn't work in this scenario.
The purpose of moving average
The moving average is used to:
- Identify the trend
- Identify the area of value
These will be one of the key aspects of our trading strategy (and I'll talk more about it later).
But for this trading strategy, these are the few things that you should pay attention to.
How to identify the trend with a moving average?
Price above the 200MA
If you want to Identify the long-term trend, you can have a very simple statement that says:
“If the price is above the 200-period moving average, then the long-term trend is up.”
So you’ll look for buy opportunities only.
Price below the 200MA
‘’If the price is below the 200-period moving average, then the long-term trend is down’’.
So you want to look for selling opportunities only.
Let me share with you a few examples.
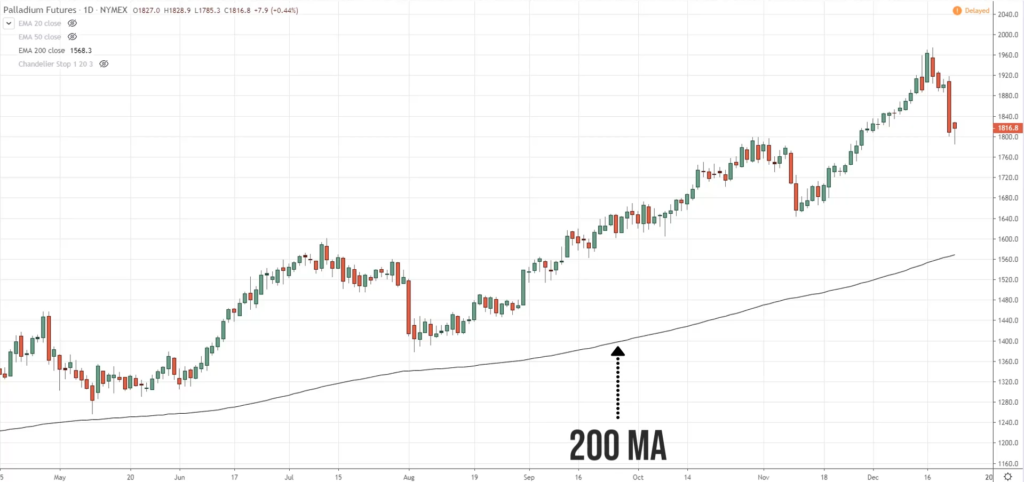
For Palladium futures:
You can see that the price is above the 200-period moving average, so you want to look for buying opportunities.
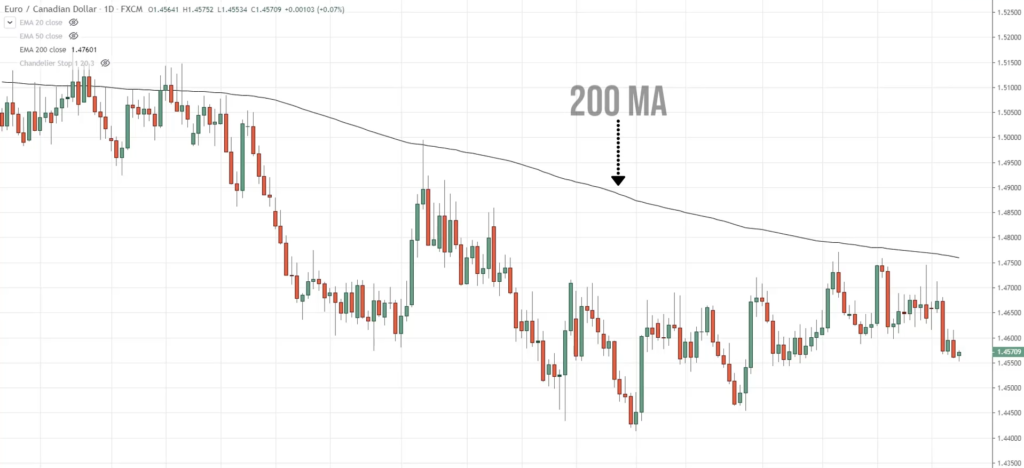
For EUR/CAD:
Since the price is below the 200-day moving average, you want to be selling.
This is how you can use the moving averages to help you decide whether you should be buying or selling.
The moving averages to help you identify the area of value
When you use the moving average, there are a few things to take note of:
- The moving averages to help you identify the area of value When you use the moving average, there are a few things to take note of:
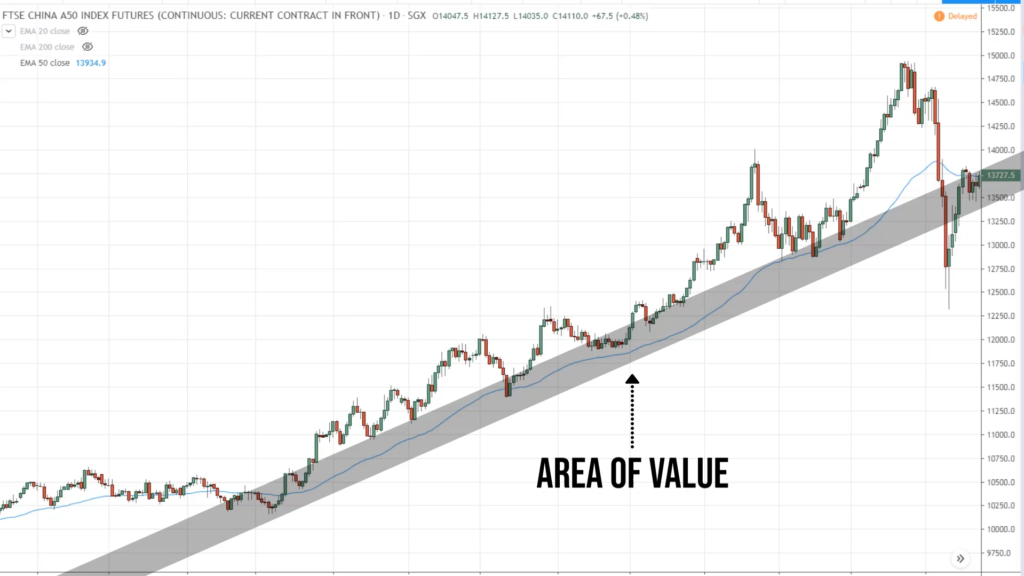
- In a healthy trend, the area of value is usually the 50-period moving average
- In a weak trend where the pullback is even deeper, the area of value is usually the 200-period moving average
Let me share with you an example.
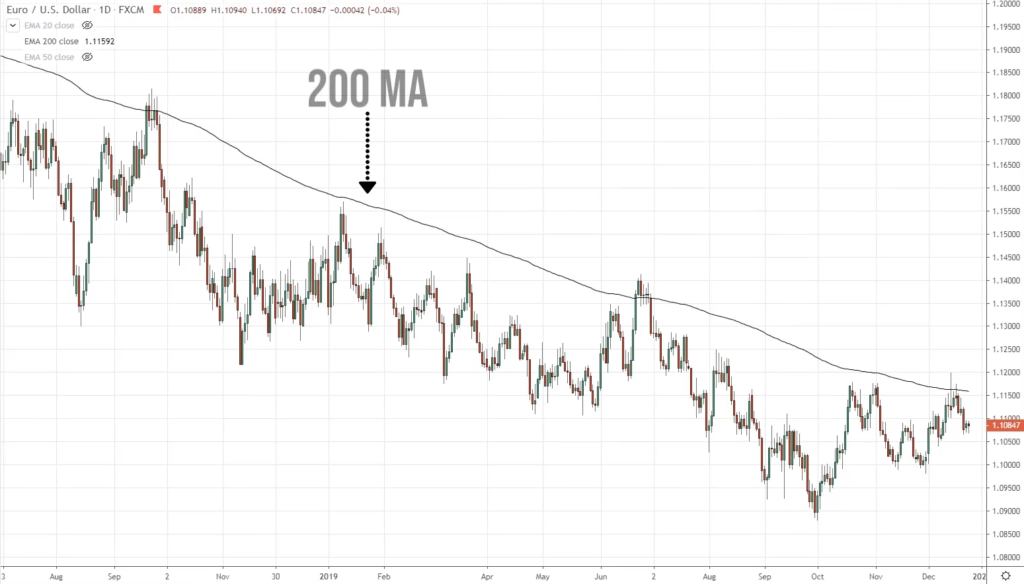
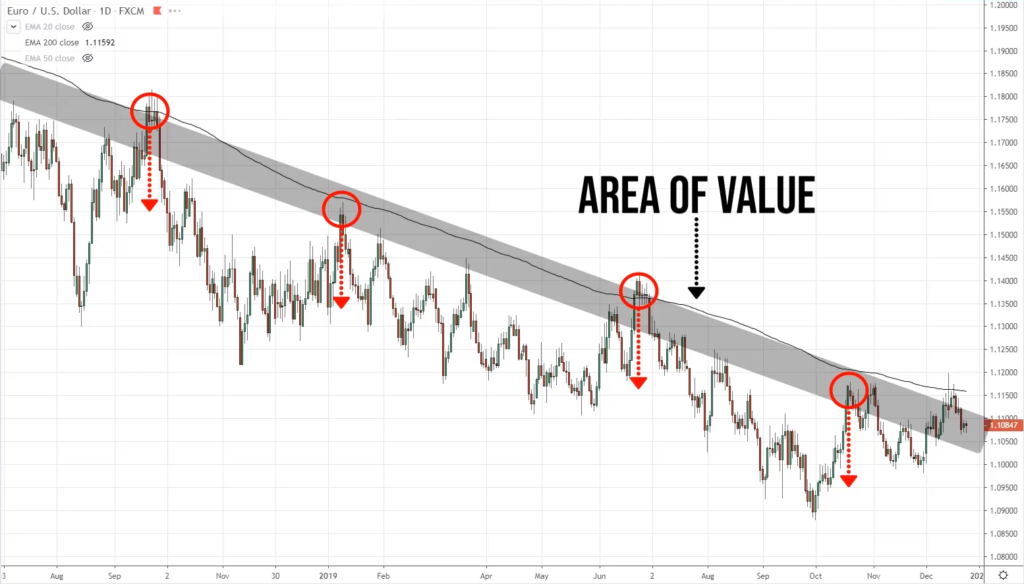
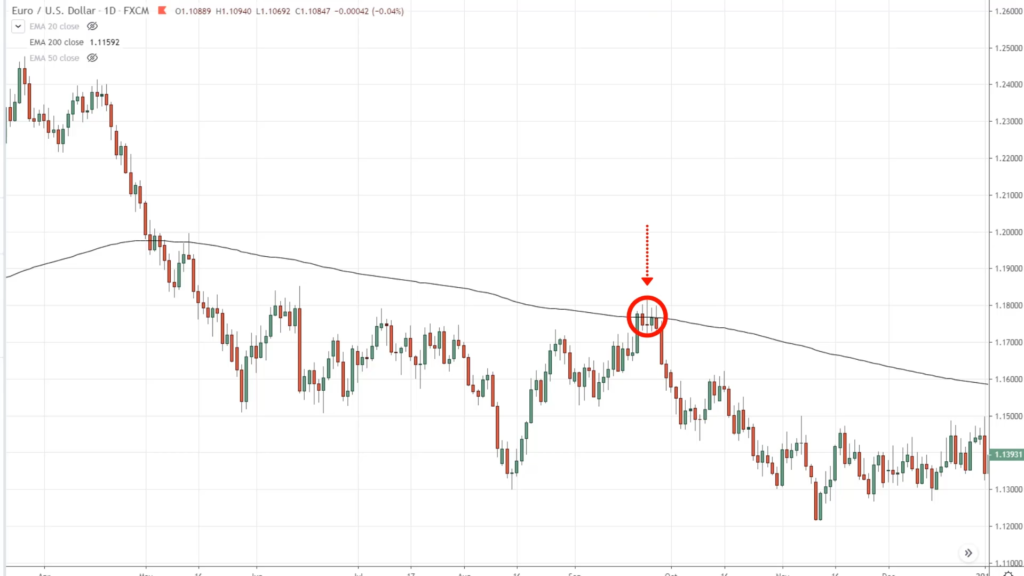
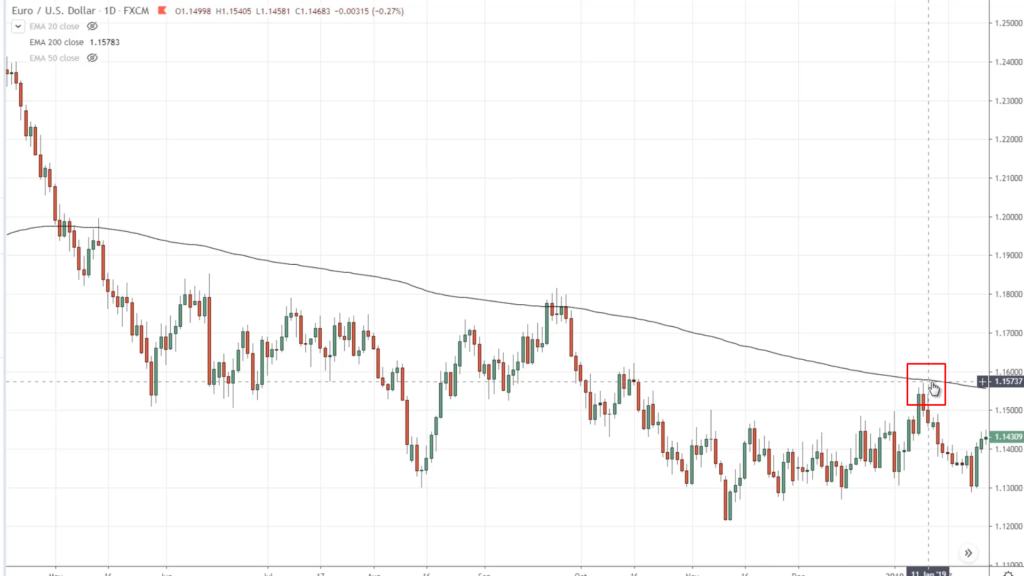
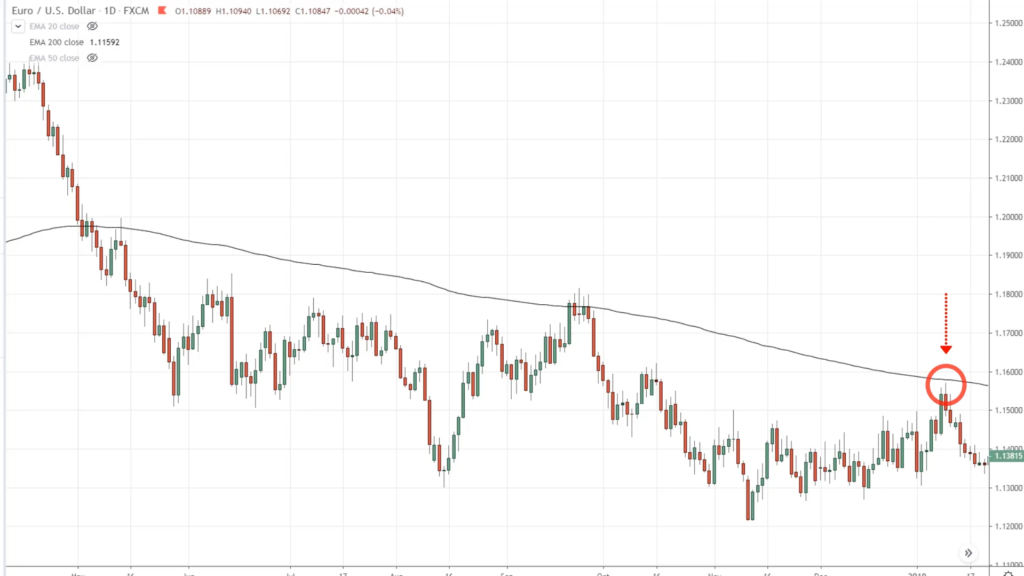
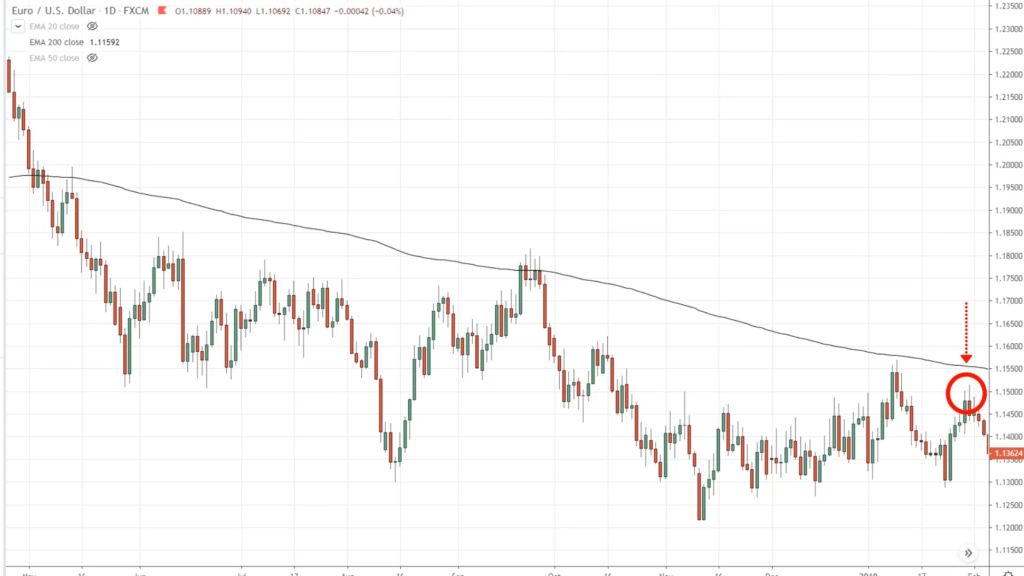
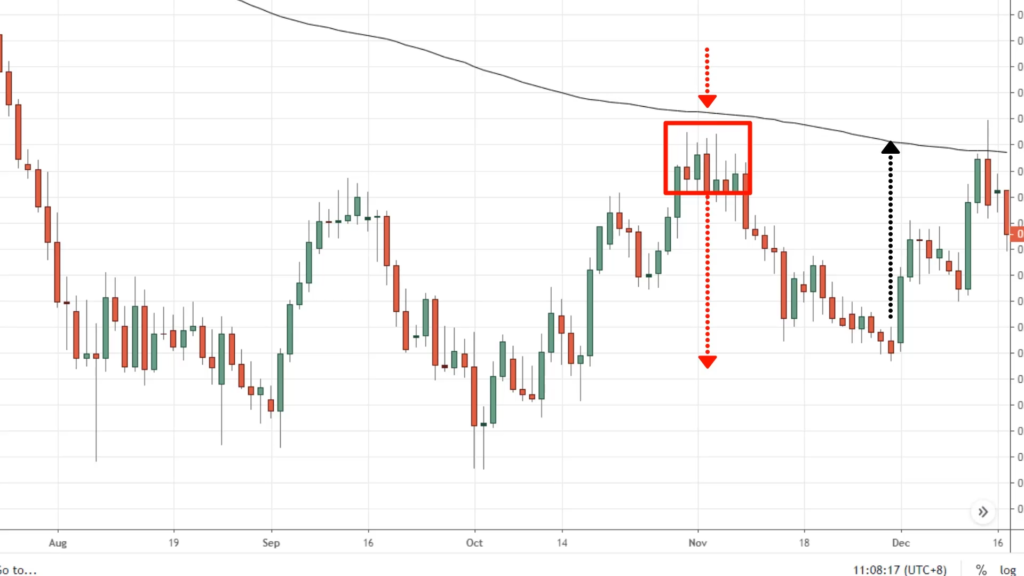
This market is in a weak trend. You notice that the price finds resistance at the 200-period moving average. This is the area of value.
Every time this market comes towards the area of value, it tends to reverse lower from there. For this market condition, in this weak trend, it finds an area of value at this 200-period moving average.
One important thing to point out is that I'm using the term “area” of value. I'm not using the term “line” of value.
What you should expect is that the market, there are times where it will not retest the 200-period moving average. It may come close to the moving average and then reverses.
Or sometimes it might even exceed the 200-period moving average and before it reverses.
You must have this expectation built into your mind. You can't expect the market to retest the 200MA to the tick and the reverse from there. It doesn’t work that way.
This is like support and resistance, they are areas on your chart.
The same thing applies for the 200-period moving average, they are areas on your chart. Whenever you look at this type of 200-period moving average, you want to have the notion that they are an area on your chart and you treat it as an area.
Maybe you could shade it or highlight it, so whenever the price comes close to that area, you are prime and ready to look for selling opportunities.
Even if the price breaks above the 200-period moving average a little bit, you won’t think that it’s broken because you're dealing with an area and not a specific line on your chart.
This is the 50-period moving average. The difference between this trend and the trend you saw earlier is the steepness of the pullback.
This pullback is not as steep compared to the one you saw earlier.
My technique for identifying an area of value
Some of you might be thinking, it’s easier to look at hindsight to know the market conditions.
But in real-time, it's not as easy to identify it and whether the market is respecting the moving average or not.
How do I know whether the market respects the area of value, or is it just a coincidence?
I'm going to share with you a very specific technique, to help you define the area of value.
I call this the minimum of two tests.
You’ll want the market to bounce off the area of value a minimum of two times before you conclude that the market is respecting this moving average.
Let me give you an example.
This is powerful, I don't think I've shared this before on YouTube, so pay close attention.
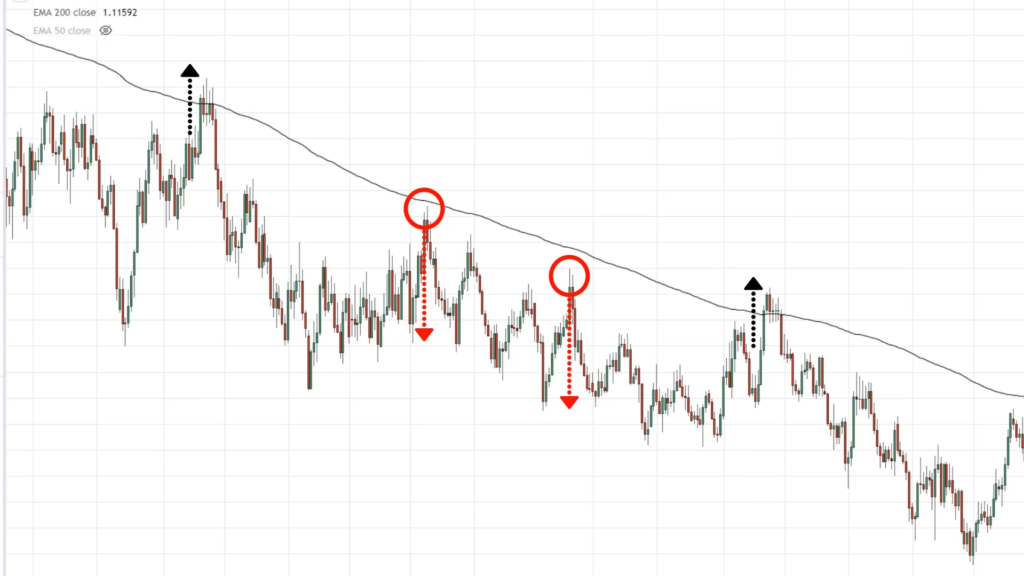
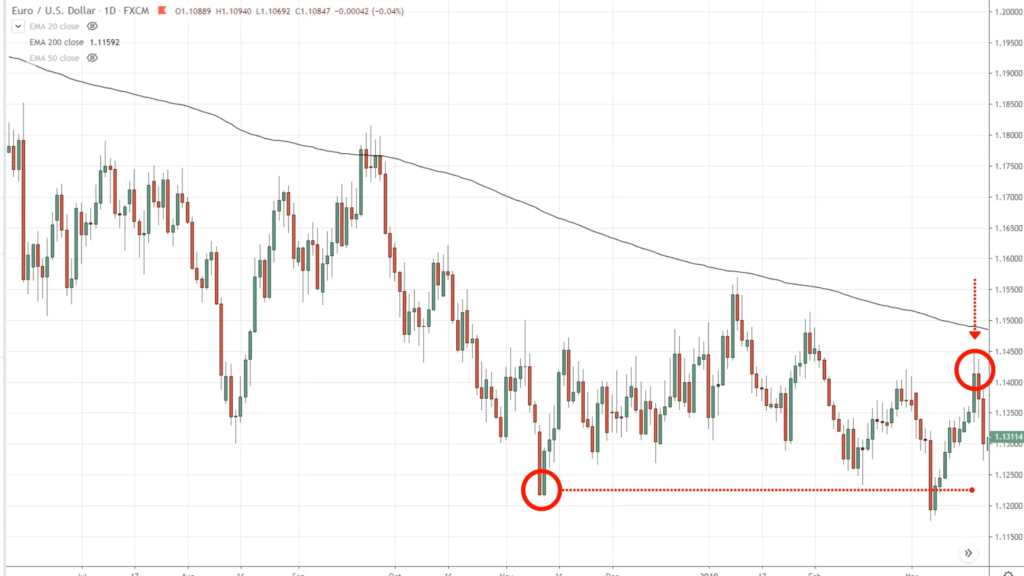
If I zoom out a little bit, you can see the first time the market tested the 200-period moving average (remember it’s an area).
Let’s make it as the first official test, at this point I may not say the market is respecting the 200-period moving average.
The second test came in over here. It doesn’t have to touch the moving average. It just has to come close to it and we will treat it as a second test.
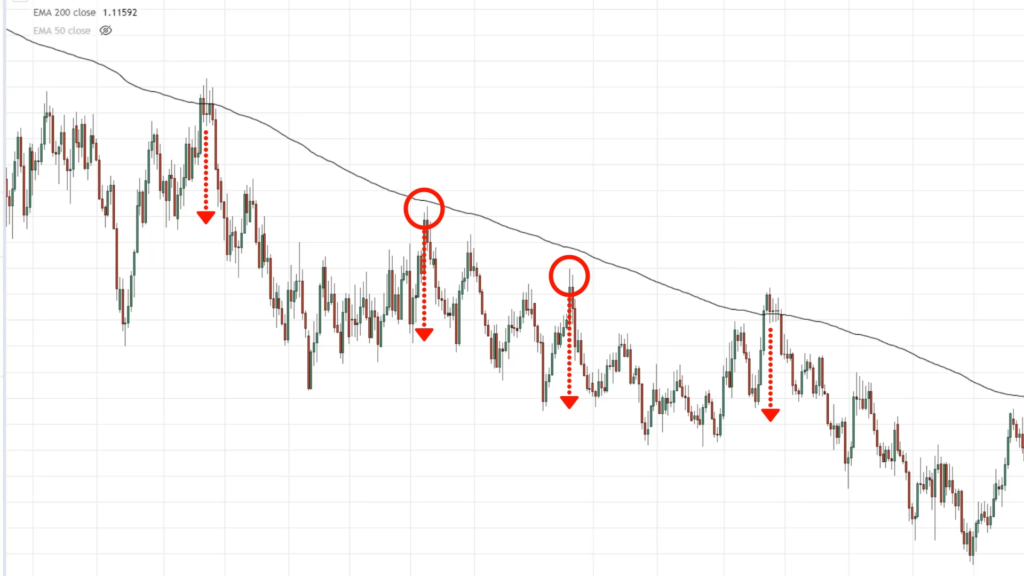
The way I define a test is that the price has to break below the swing low before I conclude it as a test.
For example, the market tests the 200-period moving average one time. The market came down, it broke below this swing low and retrace up to test the 200-period moving average the second time.
We can see that over here that it retest a third time at this point. I don't consider it a test because it has not broken below the previous swing low. This swing low must be broken before I consider it as a test.
This one over here, it broke below this swing low, and now this is the third test over here. This is where you're looking for selling opportunities.
The key thing is how to define whether the market is respecting the area of value or not. The two tests technique is what you can do to find out.
Trading setup for the moving average trading strategy
I'm going to share with you the specific setup to trade the moving average trading strategy.
1. Market condition: Trending market
Remember, moving average works best in a trending market. If the market is in a range, we don't use moving average at all.
2. Area of value: 50MA, 200MA
We are looking to define the area of value. I like to trade this strategy for a healthy and weak trend because there is greater profit potential.
The swings are wider and there are more profits to be made in such a market condition.
For the strong trend, you can use this strategy but you will have to make some tweaks to it.
3. Entry trigger: Price rejection
We will use a price rejection to signal to us that either the buyers or sellers are coming in and then we take a position.
4. Exits: Major swing points
We will exit right at major swing points.
Let's go back to our charts and have a look. You already know how to define the area of value and how to know whether it holds or not.
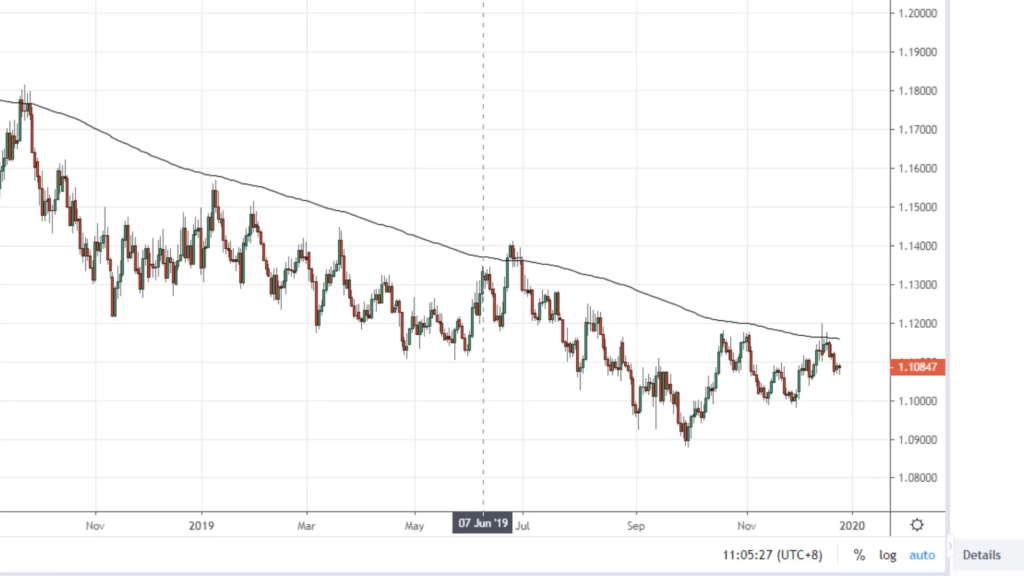
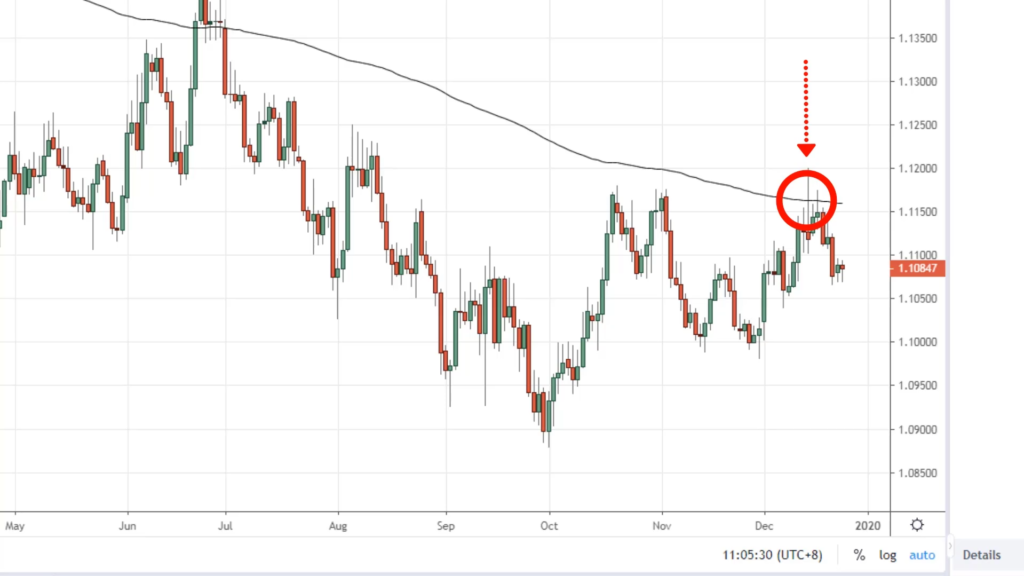
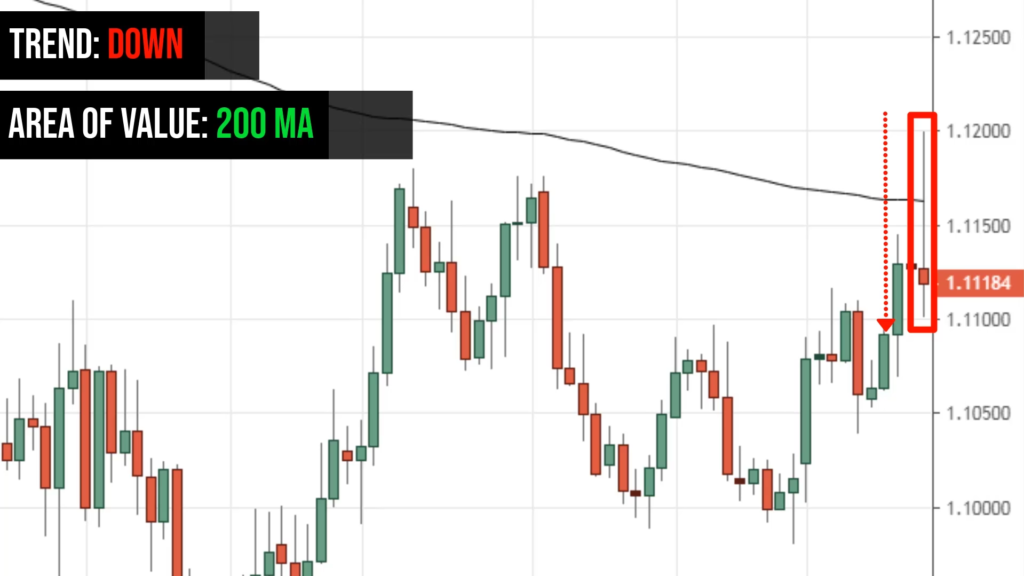
At this point, you can see that this market came back up into this 200-period moving average and formed a strong price rejection.
Price rejections are candlestick patterns like shooting star, bearish engulfing pattern. (If you're not familiar, I have a video for it you can check it out.)
For this market, you can see:
- The trend is down
- The area of value is the 200MA
- Has strong price rejection
At one point in time, it traded above the 200-period moving average, some might be thinking, “The breakout is real, let’s buy!”
What happened next was that within the same day, the market traded near the lows and closed near the lows of the day.
Traders who bought are now trapped and are stopped in their long positions. What you want to do is to go short this market, in anticipation of lower prices.
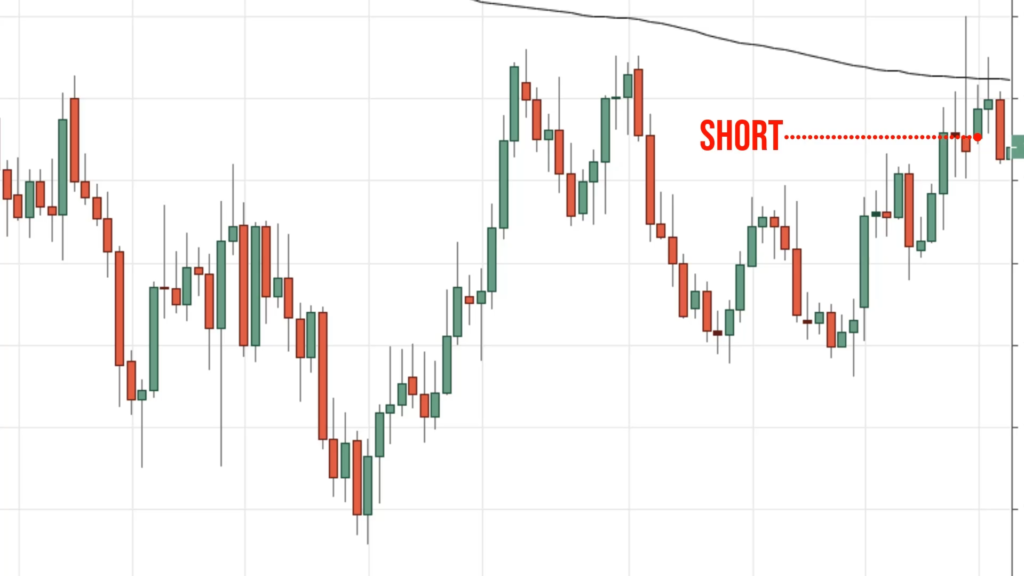
You know that the trend is down and you know that it's at an area of value, which is the 200-period moving average. So you’ll sell on the next candle open.
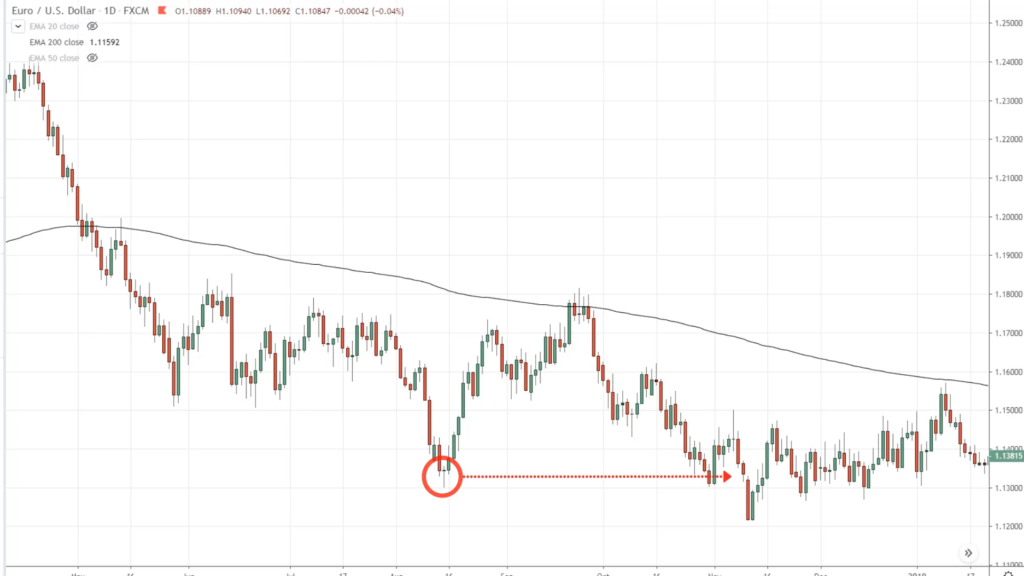
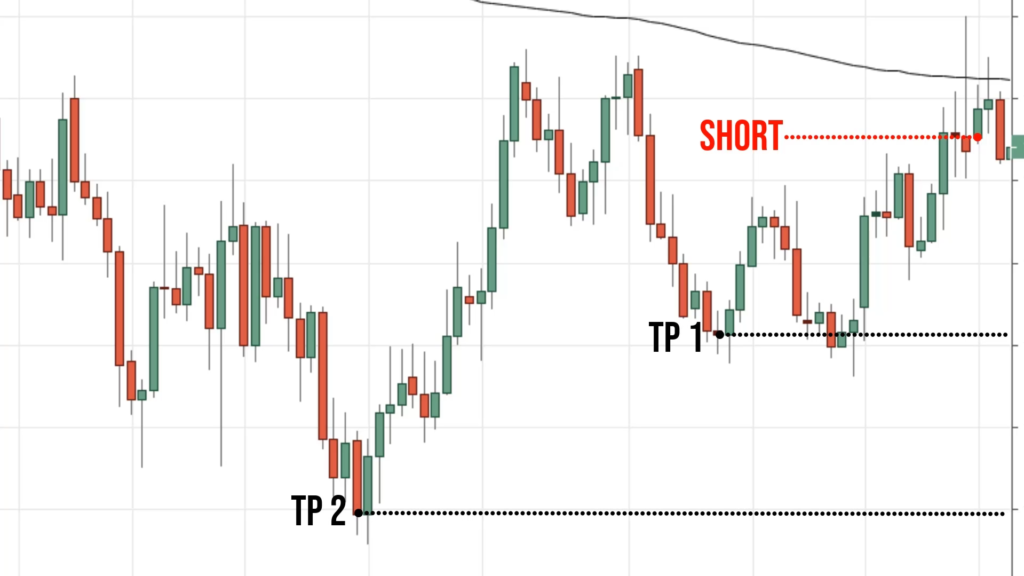
In this case, this candle opens, you can sell it over here. Remember I said that you want to target the major swing points.
Major swing points are these levels over here and this level over here. These are two possible targets, that you can use to exit your winners.
If the market is going against you again, there will be winners, there will be losers. I have no idea how this trade will turn out.
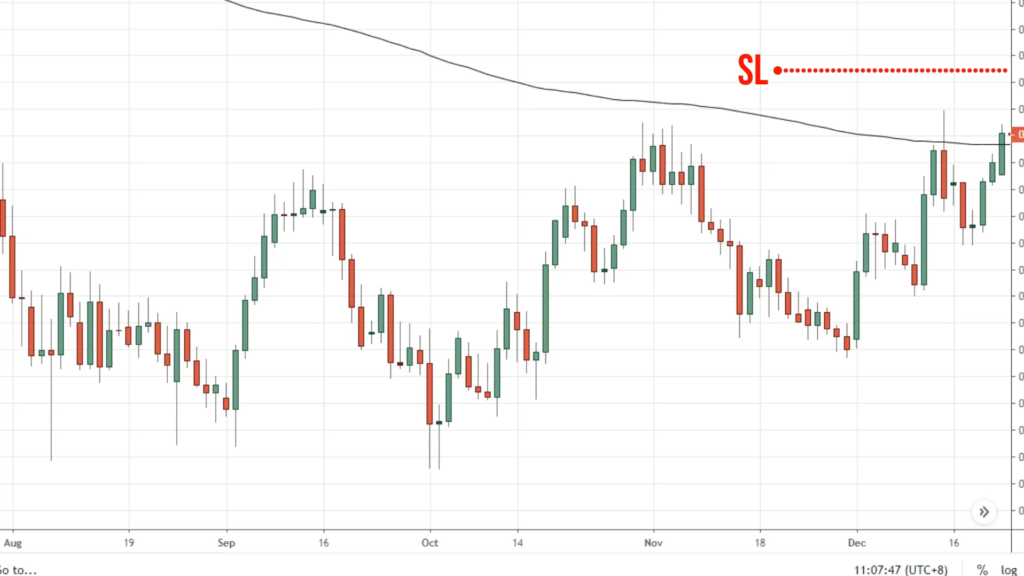
But one thing to share with you is that I usually set my stops 1ATR above the highs.
The reason I do this is because there will be retracement against me and I might get stopped on the retracement. So I give the trade more breathing room.
I don't want to set my stop loss just above this high because the market could come up higher and then reverse lower from there. If my stop losses are just above the highs, I'll get stopped out of the trade.
For example:
For traders who short at this area, the market came down but reversed to above these highs. Traders who are short and haven’t exited their positions, with their stop losses above these highs, they would have gotten stopped out on this pullback over here.
This is why I like to set my stop loss away from the highs and lows in the market.
I have another example to share with you. Let's just zoom out a little bit to this portion over here.
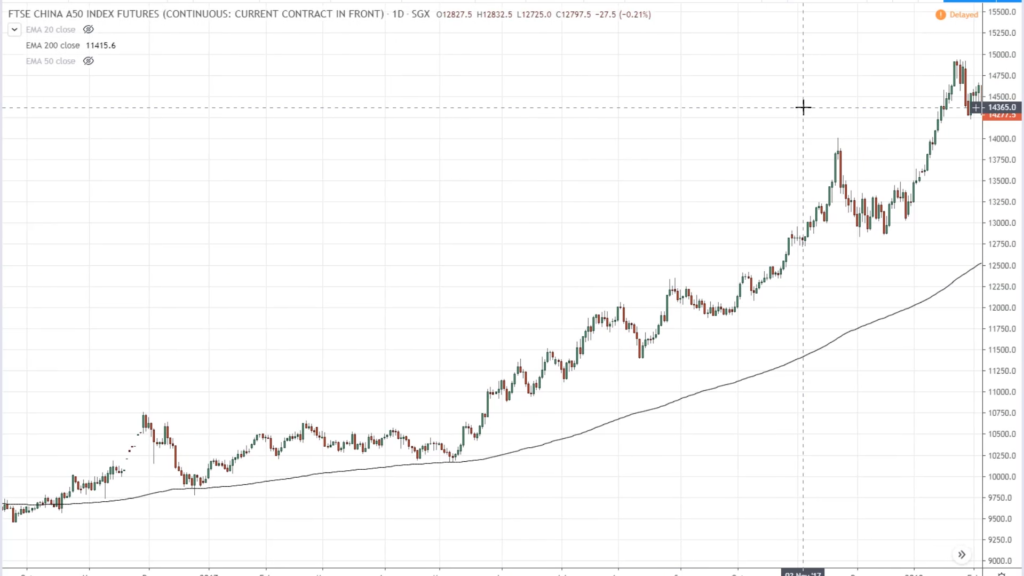
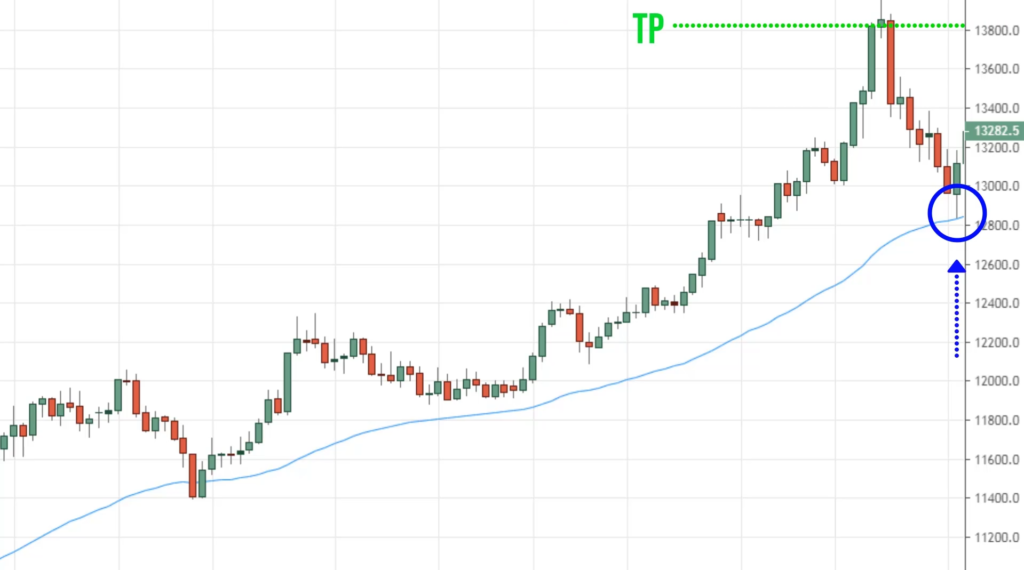
The long-term trend here is up. This particular market condition is in a healthy trend, it respects the 50MA. How do I know that?
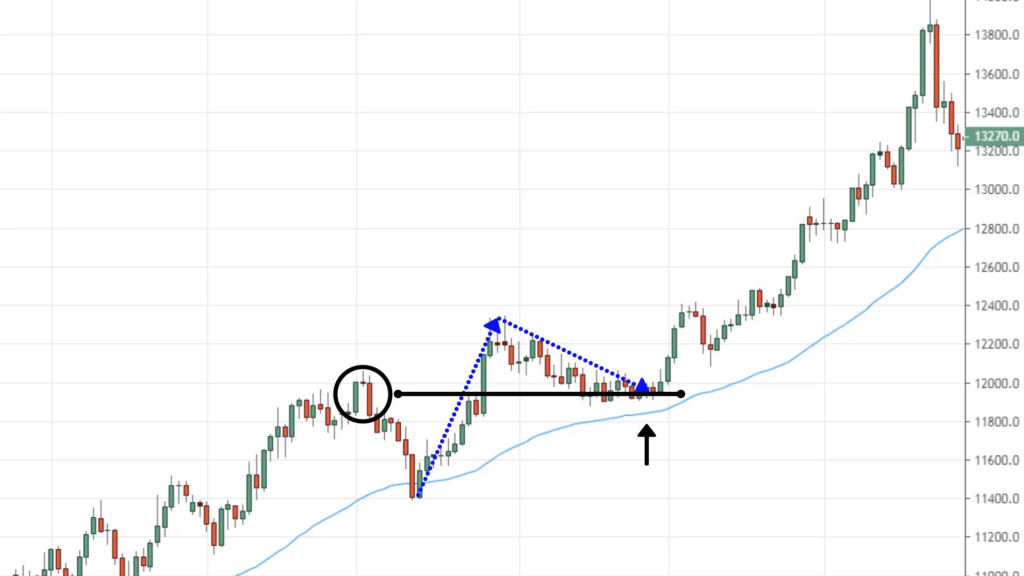
Let's do the two tests technique:
The market tested the 50MA once, traded higher, then broke out above this high, retested the second time.
It didn’t test the moving average to the exact peak. But since we’re dealing with an area of value, not a specific line on the chart, I still consider it a second test.
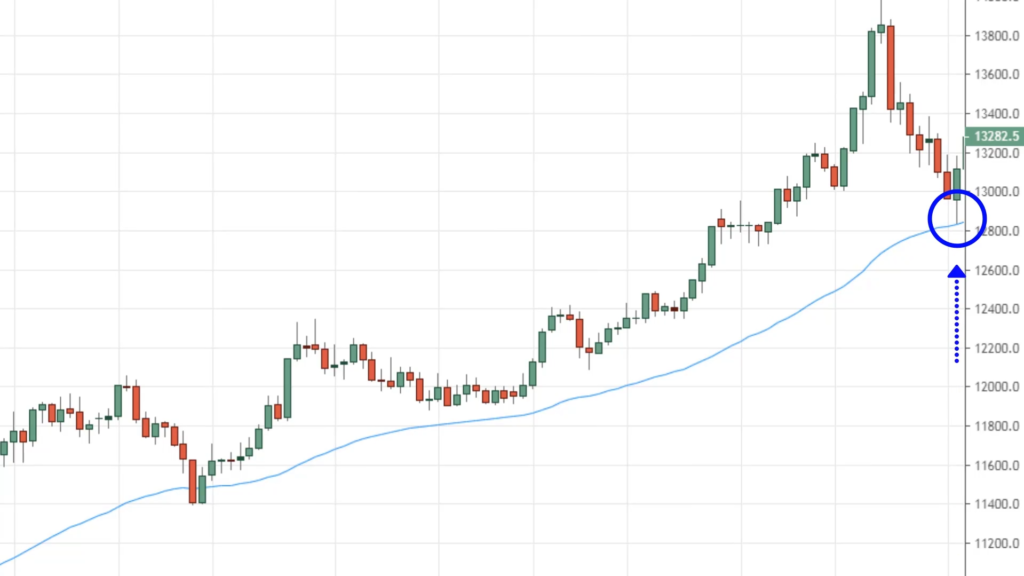
The market went up higher and did a test. This is where we want to time our entry to go long and we have an entry trigger which is a bullish price rejection.
The market was at one-point trading near the lows at the 50MA before the buyers stepped in and the price closed near the highs of the day.
This is a valid entry trigger to go long, to buy in anticipation of higher prices. For targets, you can target the major swing points, which is possible at this swing high over here:
Bonus technique to exit your winners
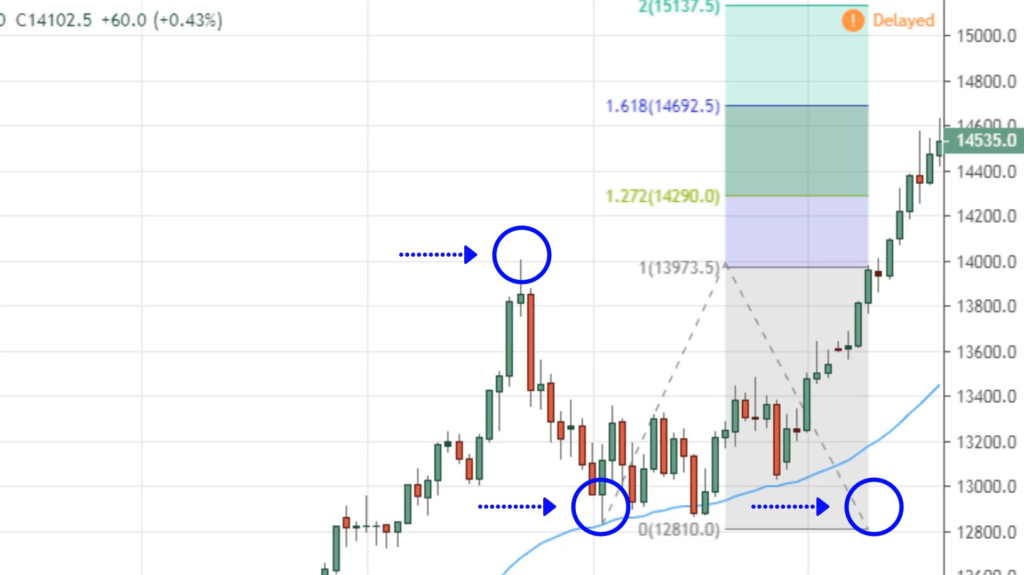
For a healthy trend, another technique that you can use to exit your winners besides the swing highs or lows is to use the Fibonacci extension.
If you look back at the market condition, you realize that often this market tends to break above the previous high by a little then it reverses.
You can imagine there's a good chance that the market will not reverse exactly at these highs. It could exceed these highs by quite a bit before it pulls back again.
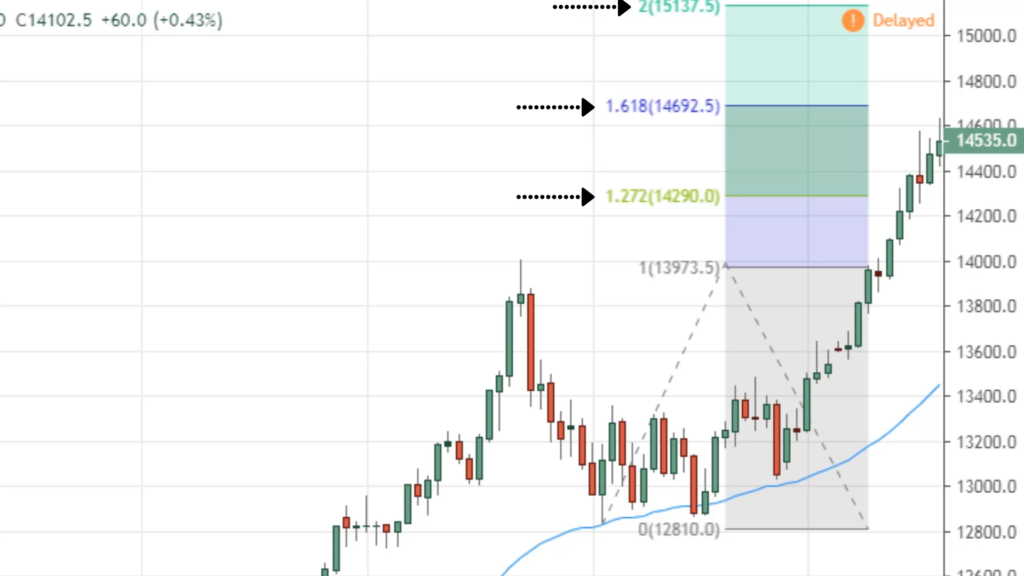
This is where the Fibonacci extension comes into play. Look for the trend-based Fibonacci extension. Draw it from swing low to swing high.
I pulled the tool from this swing low to this swing high and I pull it back down here to the swing low again.
A few numbers are popping up, you have the 1.27, 1.62, 2.0 extension.
Where do you want to take profits? It depends on how aggressive or conservative you want to be. The 1.27 and 1.62 extensions are possible levels to take profits.
If you're more conservative, you don't want to aim for a huge home run, you can look for targets at the 1.27 extensions to exit your swing trade.
The Fibonacci extension tool can help you capture a bigger swing in a healthy trend.
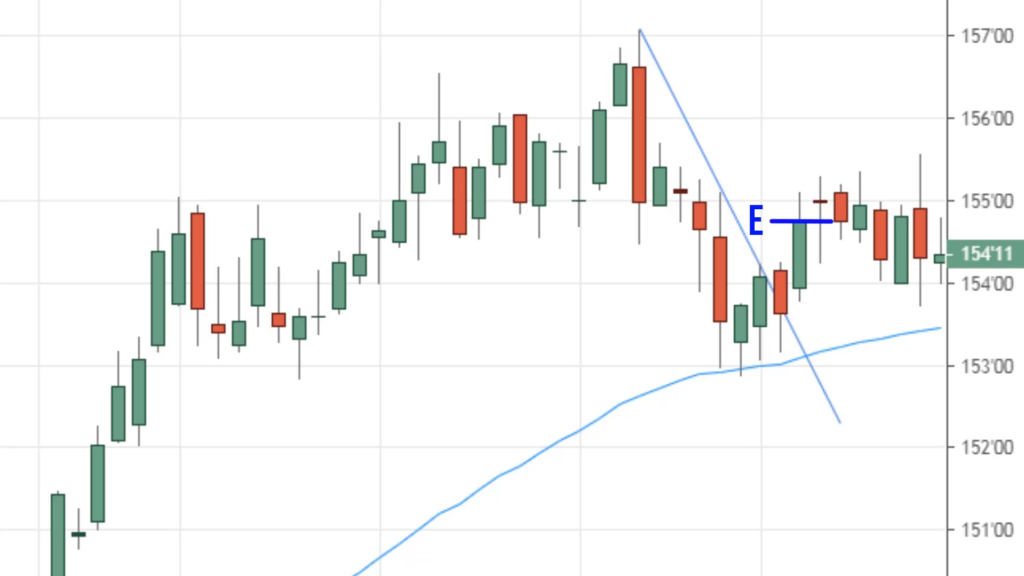
Time your entry using the break of trendline
What you'll do in this case is just pull out a trendline connect it from the highs.
Notice the candle has broken and closed out of the trendline. That’s another type of entry trigger you can use to get onboard a long trade in this market condition.
Since this is a healthy trend, you have different ways to exit the trade:
- Major swing points
- Fibonacci extension
These are strategies to trade the moving average.
How to improve your R:R
You can achieve a better risk to reward using multiple timeframe analysis.
For example:
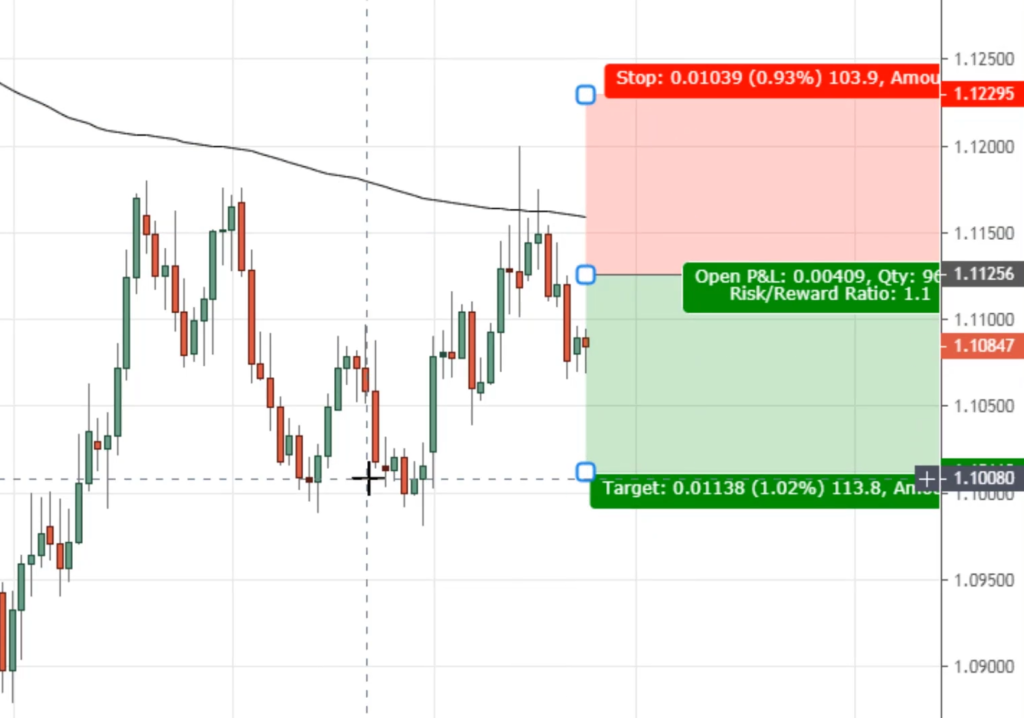
Price is respecting the 200-period moving average. Traditionally, how you will trade this market is that you will go short at the next candle open with stop loss 1ATR above this high.
For the profit target, the swing low is you’re targeting at:
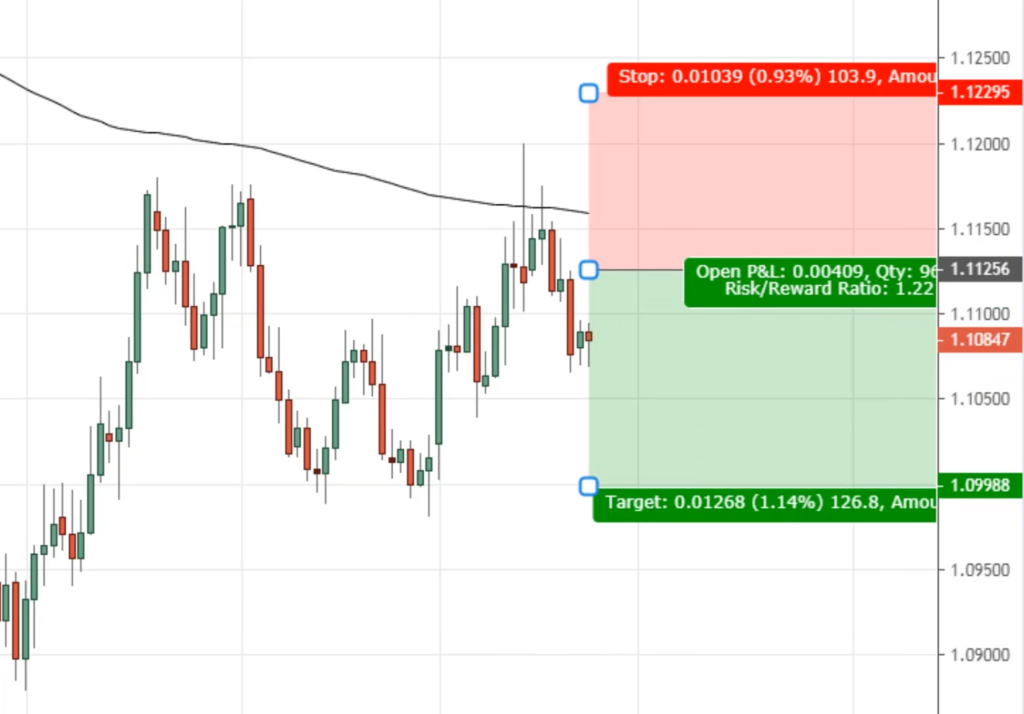
We have a 1:1.22 R: R ratio. Risking $1 to make $1.22.
It’s pretty decent, but is there a way to improve on this? The answer is yes.
You have to use multiple timeframe analysis for this. You want to go down to a lower timeframe like the 4-hour time frame.
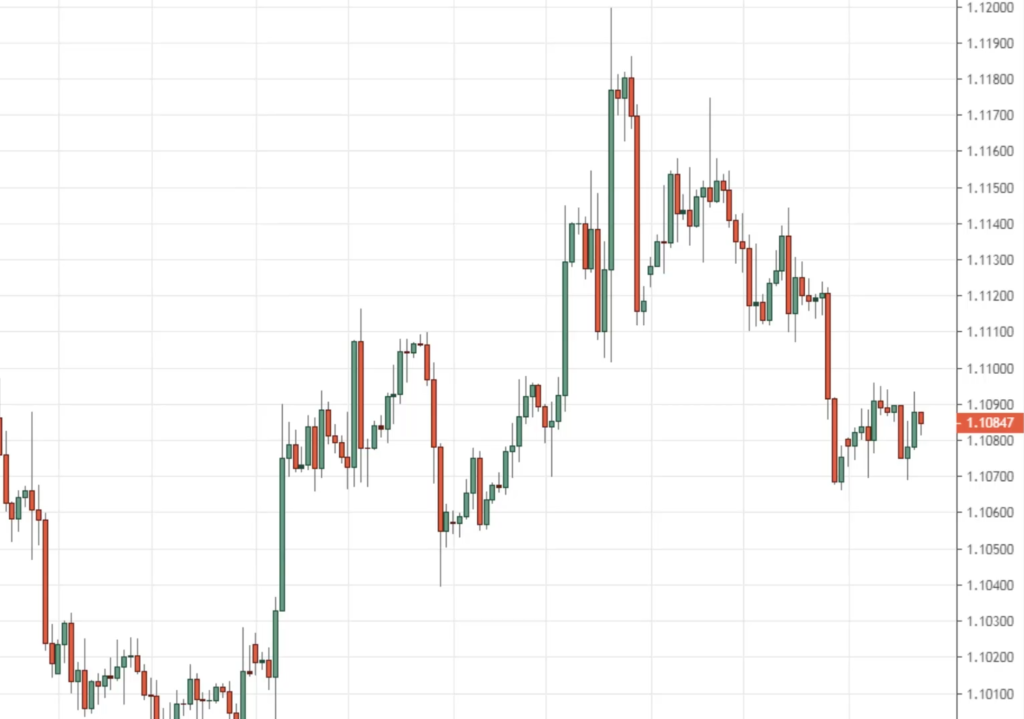
You'll notice that this market, on the pullback, it forms a series of higher highs and higher lows. This is common sense.
What you're looking for is for a break of structure. You know that the long term trend is down. You know that you are trading at an area of value at a 200 MA.
You want to enter it on the first sign where sellers are in control and they are about to take the price lower. You're looking for a break of structure.
What is a break of structure?
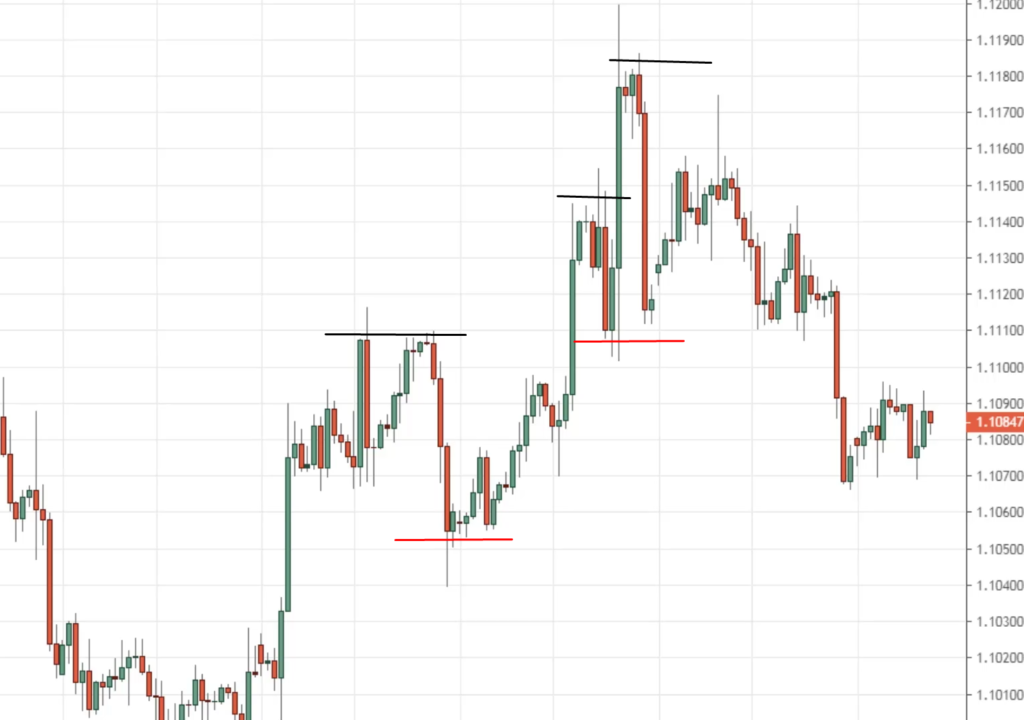
Over here you have a series of higher highs and higher lows. What you're looking for is a series of lower highs and lower lows, telling you that, “Hey, now the sellers are coming in and about to take the price lower.”
Where did the lower highs, lower lows come in?
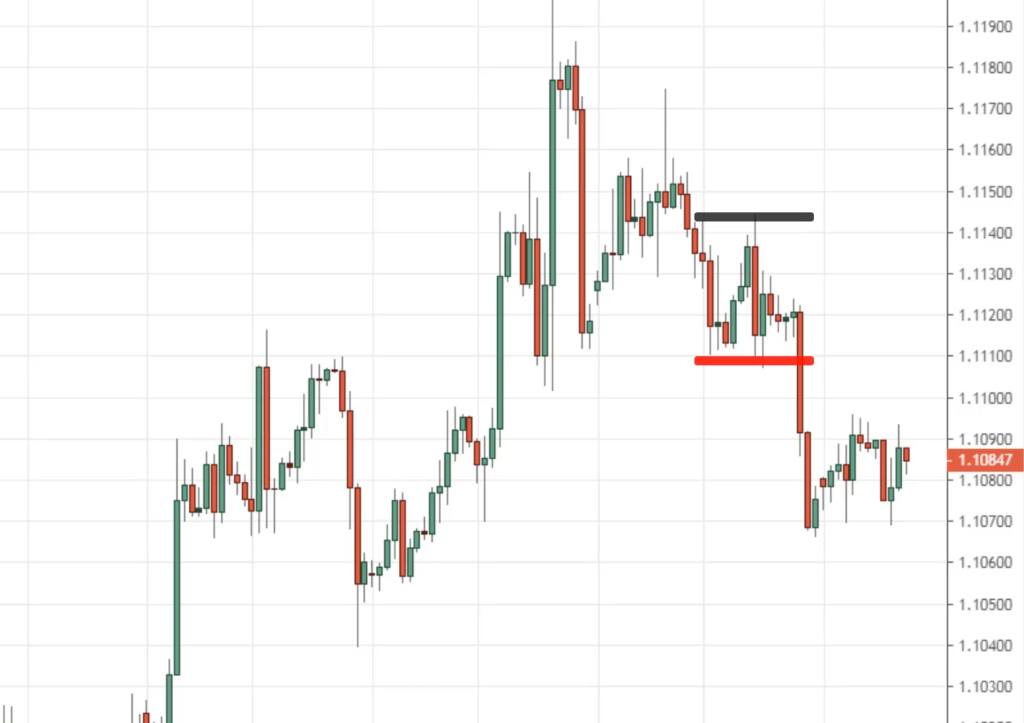
What you can do is that you can look to sell when the price breaks below this swing low, because, at this point, you will have a lower high and lower low your chart.
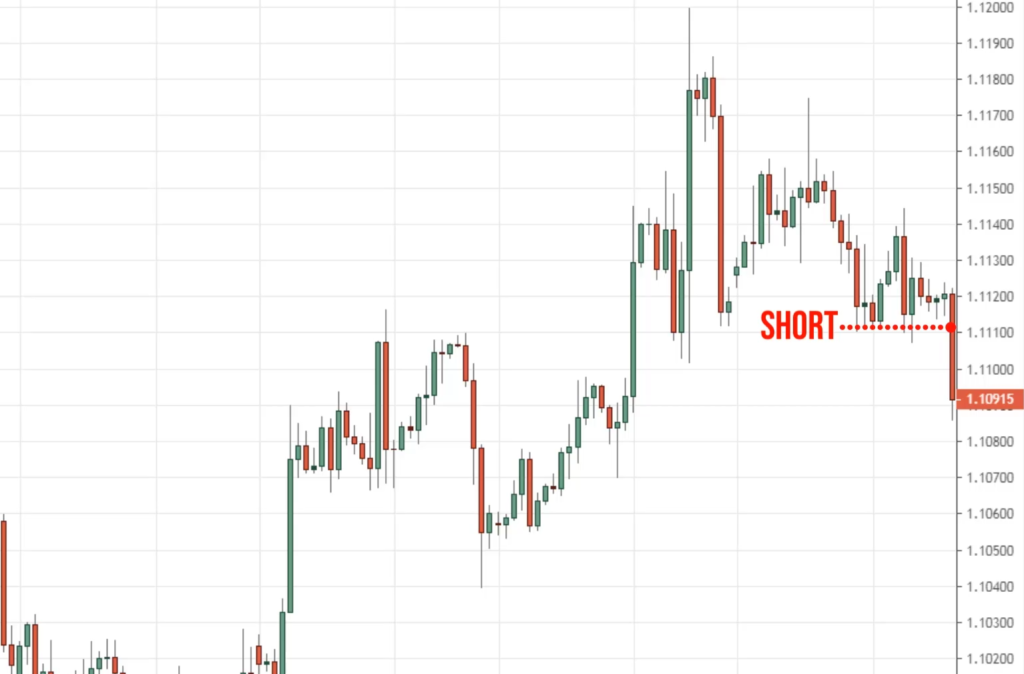
You can look to sell when the price breaks below this swing low on your daily chart.
And because you're on a lower timeframe or you can use the lower timeframe break of structure to set your stop loss.
Recall, your stop loss was 1ATR above these highs over here on the daily timeframe.
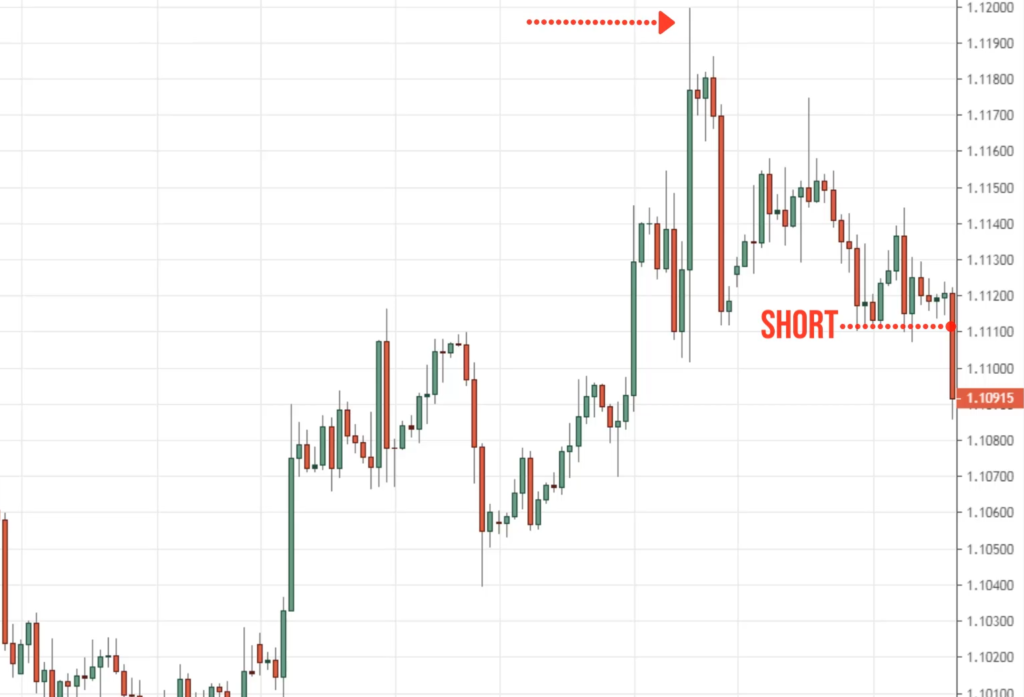
What you can do now is use the lower timeframe market structure to set your stop loss.
You can see that now, your risk to reward has improved:
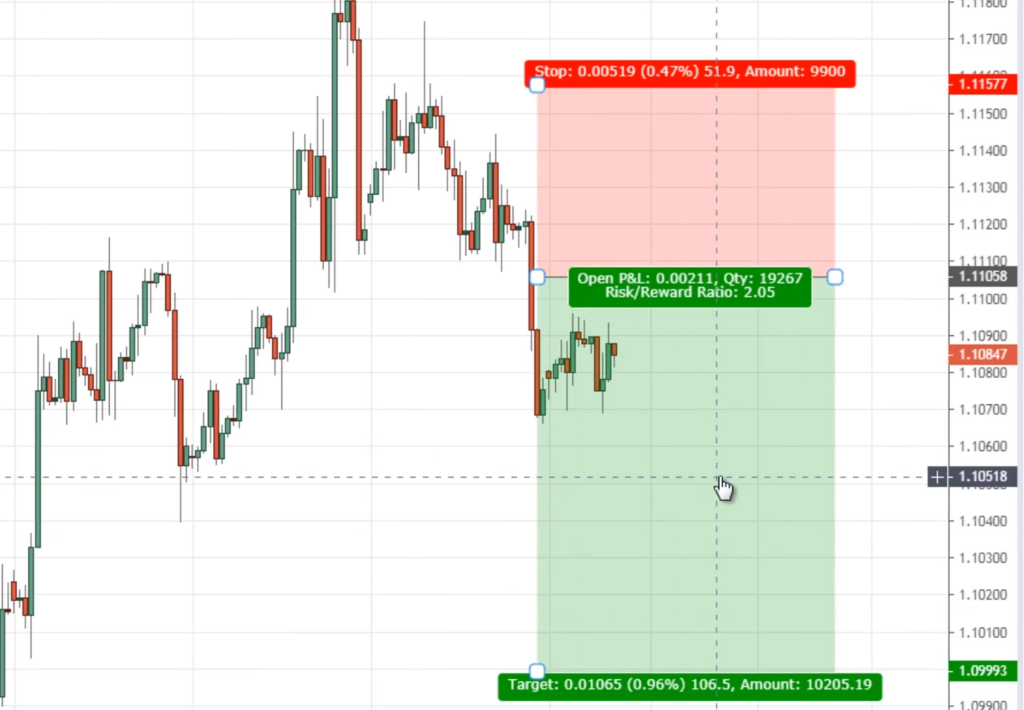
You’re now risking $1 to make $2. Your analysis is the same and your profit target is the same. The only difference is to use a tighter stop loss via the lower timeframe, which improves your risk to reward.
This technique will allow you to improve your risk to reward for your trades. And this is advanced because you're using multiple timeframes.
Recap
- Avoid using Moving Average in range markets
- Moving Average can be used to identify the trend and area of value
- A minimum of 2 tests to confirm the area of value
- Setup: trend, area of value, entry trigger
- How to use the lower timeframe market structure to improve your risk to reward

