#12: How To Buy High And Sell Higher
Lesson 12
Hey hey, what's up my friend!
So here's the thing:
Many traders think that to make money in the markets, you need to buy low and sell high.
Well, that's true.
But…
It's not the only way to make money.
Because you can also buy high and sell higher.
Here’s what you'll discover in today's lesson:
- The secret to buying high and selling higher (with low risk)
- The reason why most traders buy high and lose money – and how you can avoid it
- The ONE thing I always look for before buying at “high” prices
(If this one thing isn't present, I’ll almost always skip the trade.)
Sounds good?
Then let's get started.
Don’t make this trading mistake…
Let me share with you a mistake that traders make whenever they buy high.
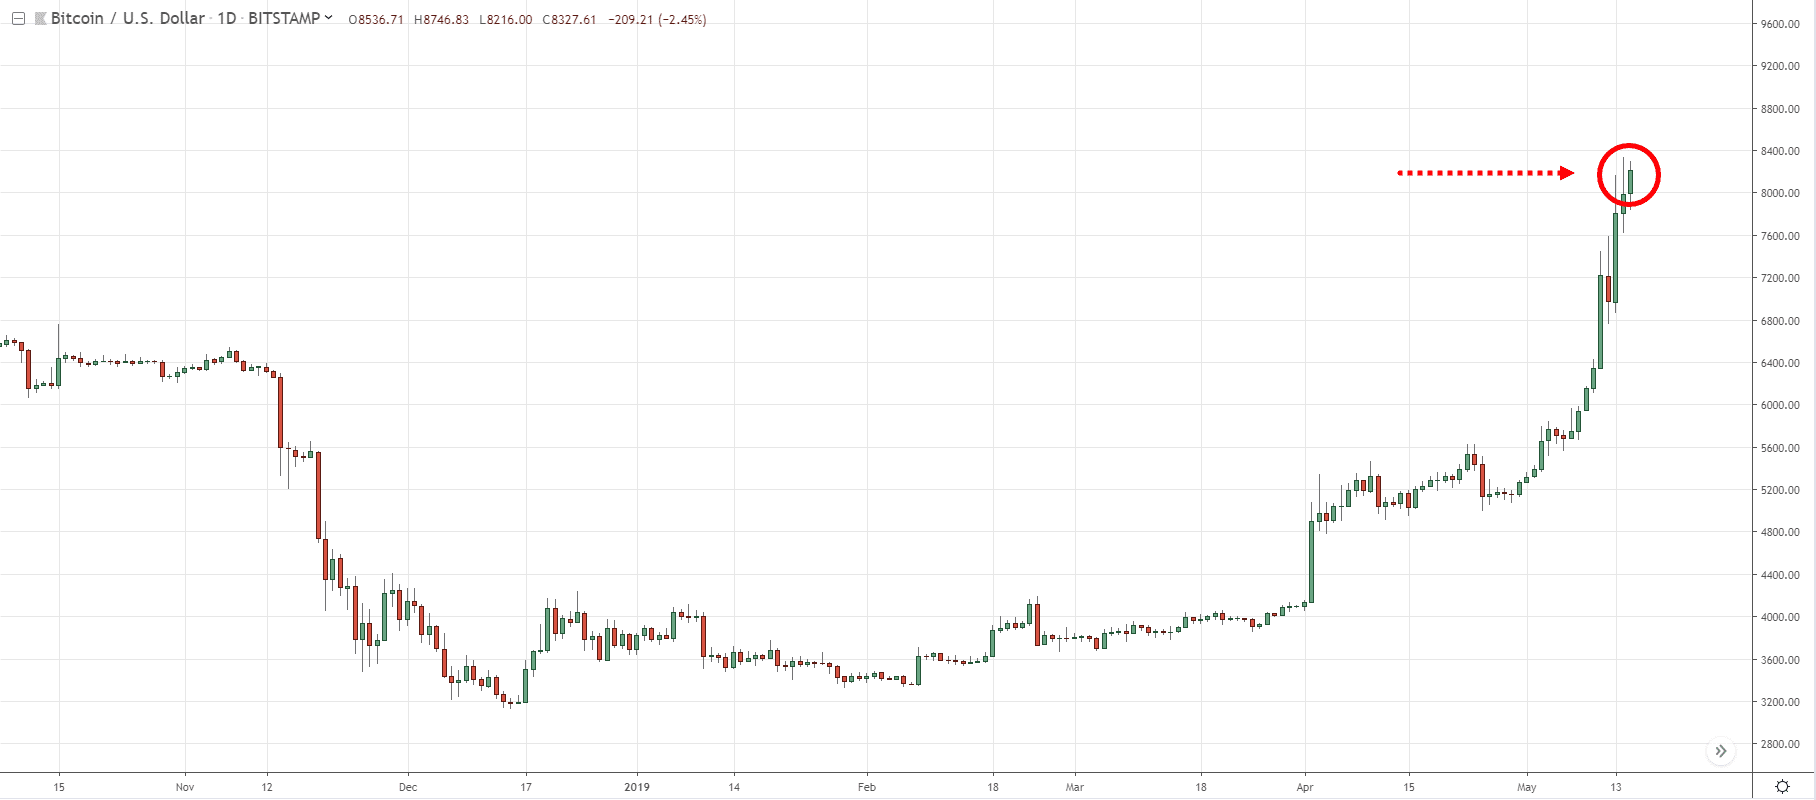
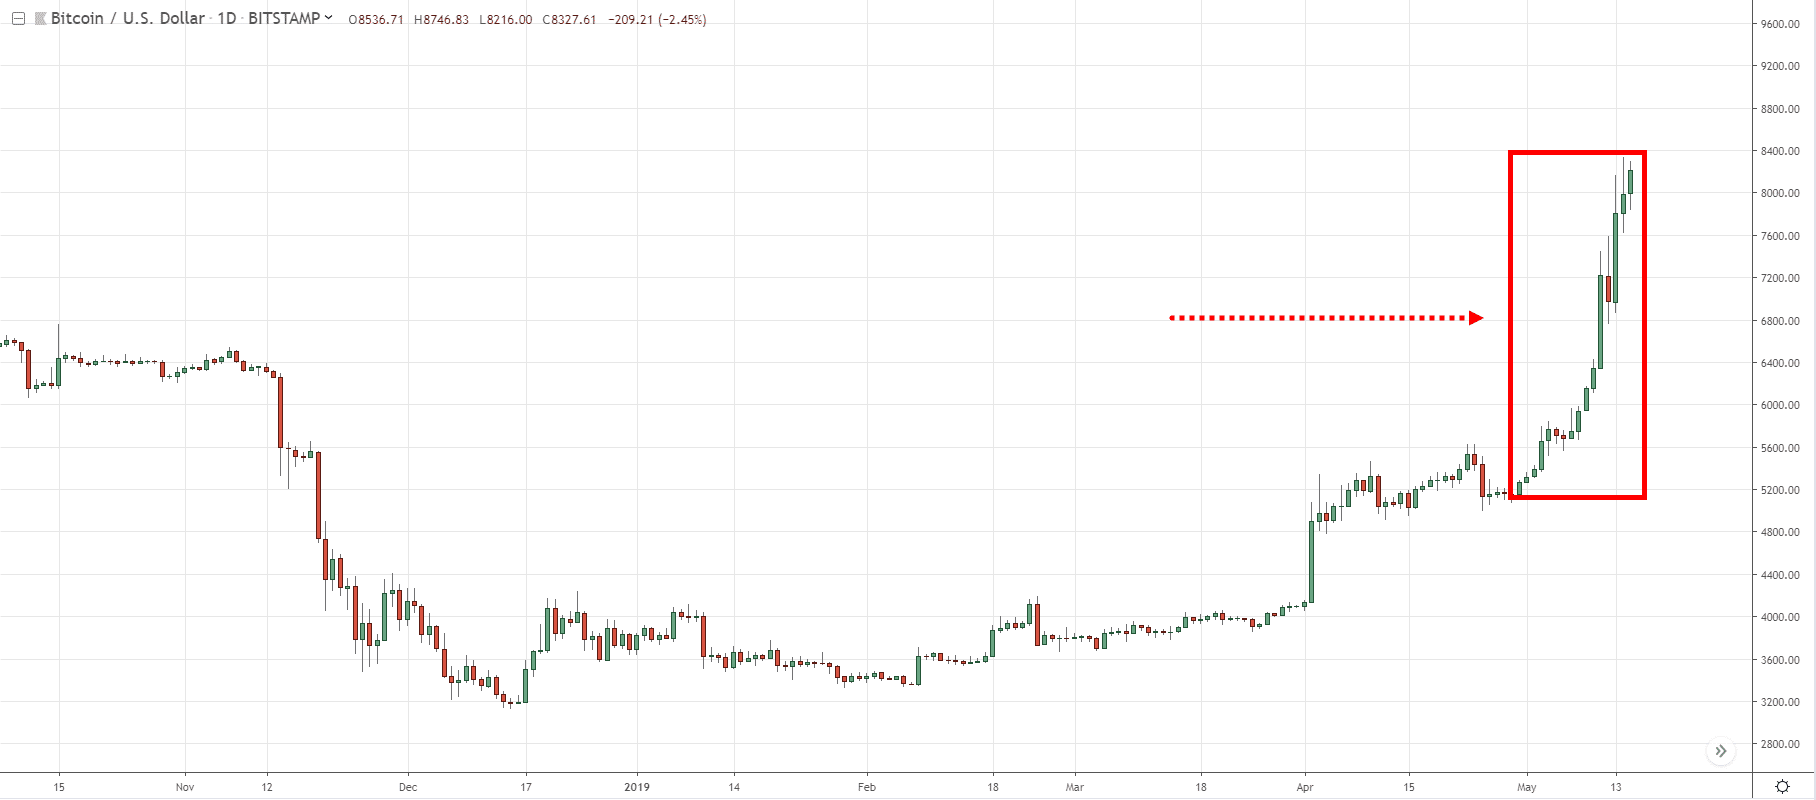
Take for example this chart of Bitcoin:
Traders will look at this chart and they’ll say…
“Oh man Bitcoin it's so bullish, I need to get on board this move.”
“Because if I don't buy now, I’ll miss the move up higher.”
“Look at how bullish the market is, with its strong bullish momentum and large range candles.”
“I need to be buying now!”
That's what a lot of traders will do.
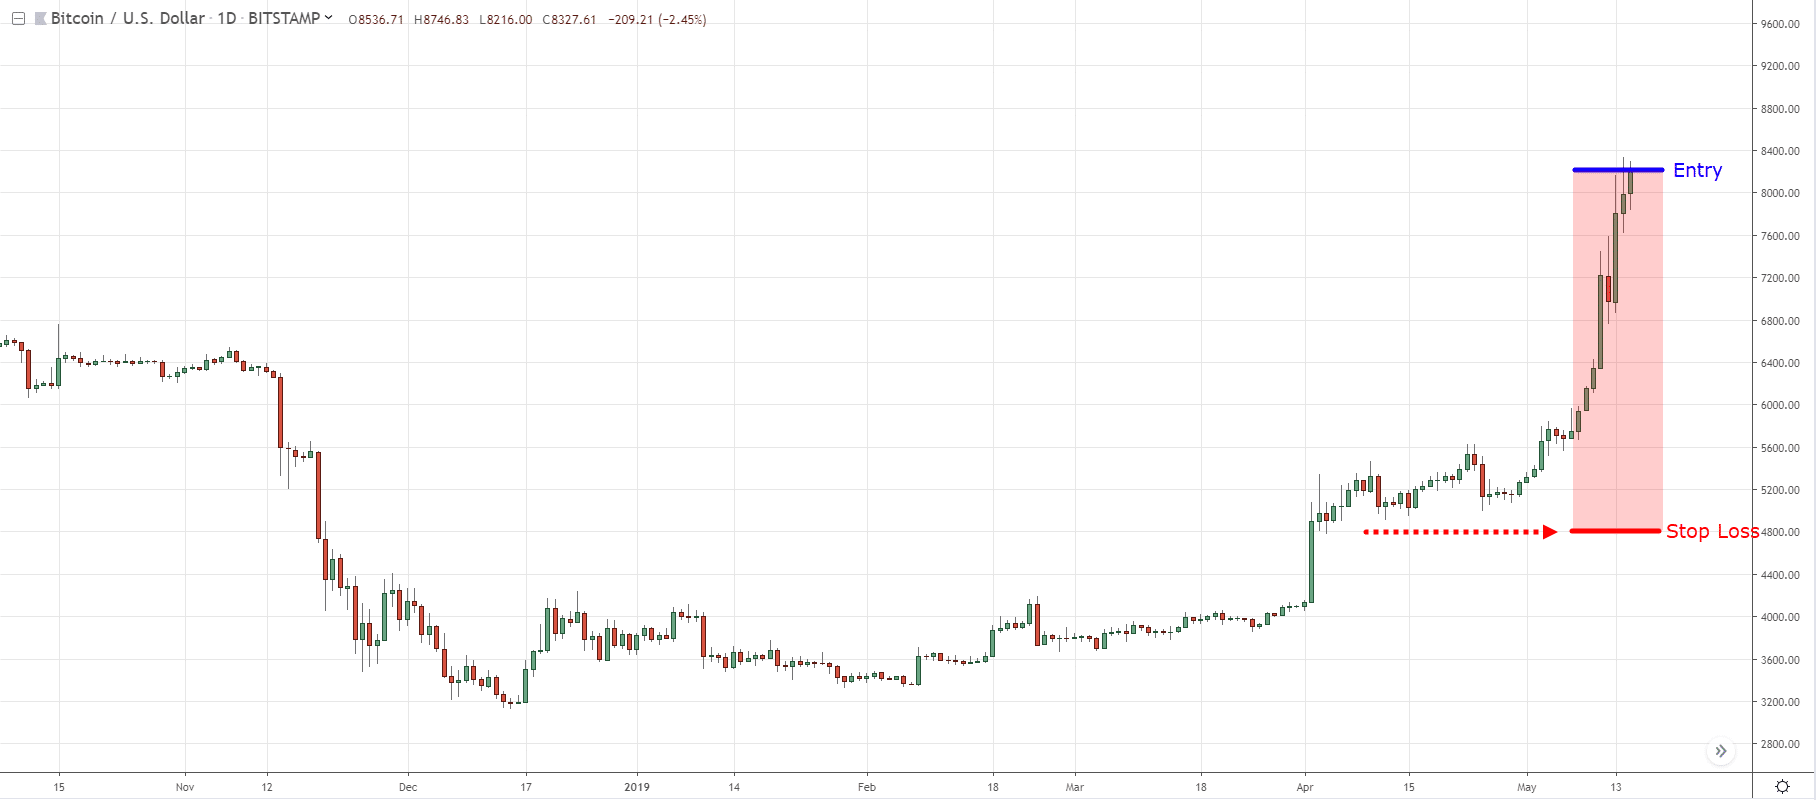
They’ll buy at this high price at around $8,200 level.
And after entering the buy trade, then they think to themselves…
“Okay maybe I need a stop loss, where should I put my stop-loss?”
Intuitively, they know they need to set their stop loss at a logical level.
Since this is an uptrend, their stop loss should be below the previous swing low.
And they’ll think to themselves…
“But if I were to set my stop loss at $4,800, my stop loss is going to be too wide.”
They can't swallow that kind of loss.
So where would they put their stop loss?
Since they can't accommodate such a huge stop loss, they’ll randomly put a stop loss to feel safer.
If the market goes against them, they can contain the damage.
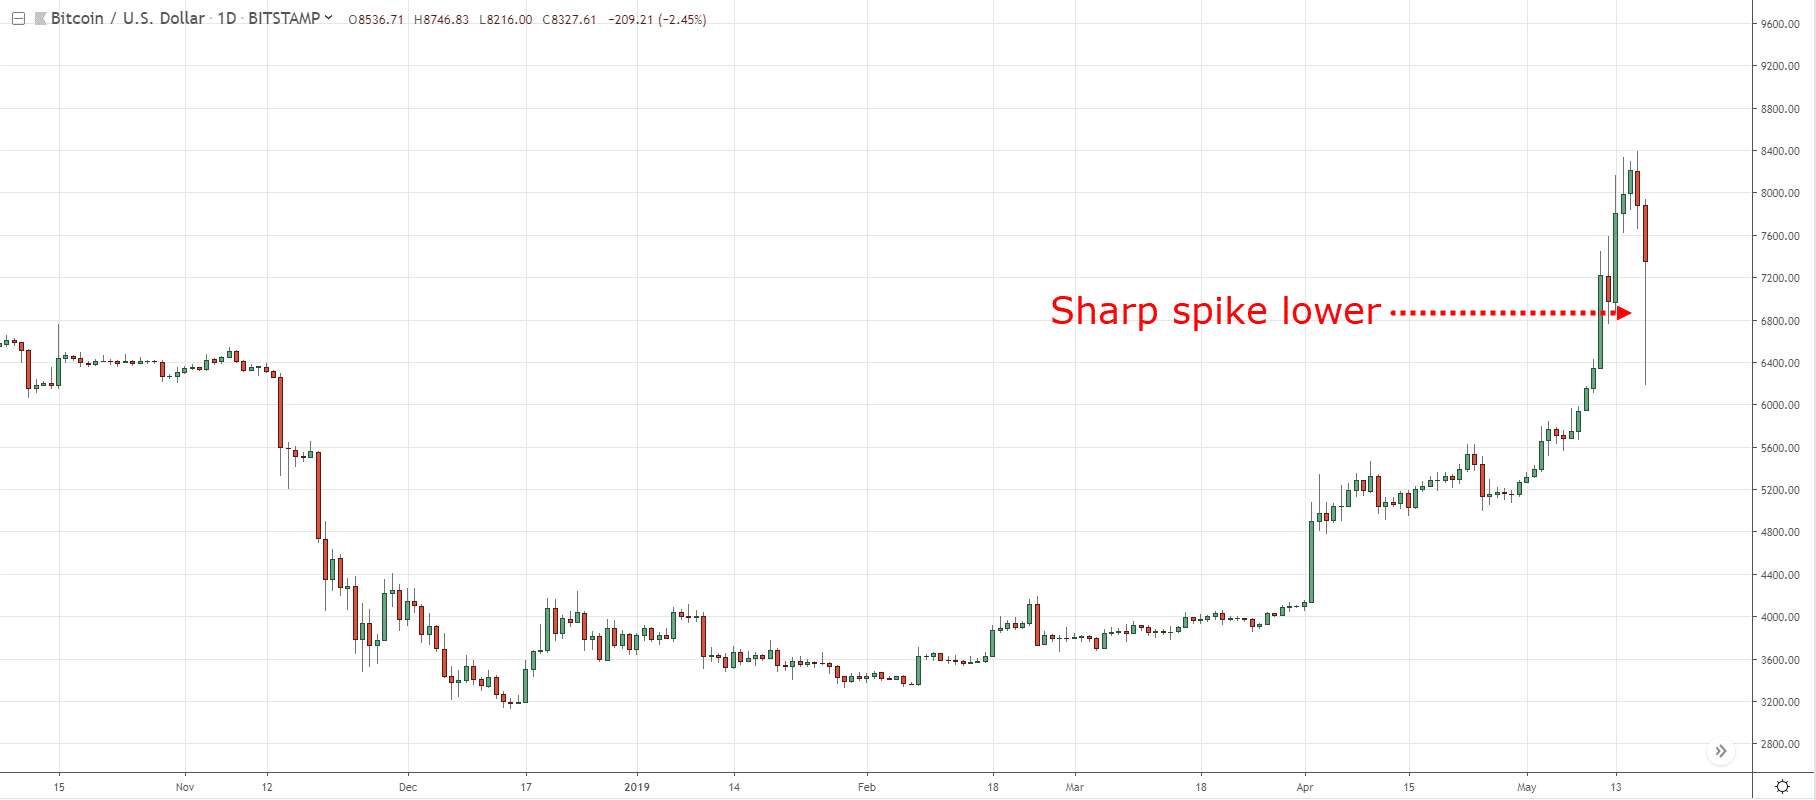
And that's what happened.
The market often goes against them and they get spiked out of the trade.
And then the market continues to rally.
Then they’ll say:
“The market is rigged, why does this always happen to me?”
“The market is unfair.”
“The brokers are out against me.”
But no.
They are the ones who are rigging the game against themselves.
So the biggest mistake that traders make is – they are chasing the markets when the market is bullish.
When it's high, they just want to buy due to the fear of missing out.
And after they buy then they wonder where they should put the stop loss.
By that time, then they’ll realize that a logical place to put their stop loss is too far away.
So they’ll put a random stop loss on their chart.
And they’ll get stopped out on the reversal before the market continues higher.
This is the mistake that I want you to avoid.
Yes, you can buy high.
But you don't want to buy high at any random point in your chart.
Because when the pullback comes, you’ll often get stopped out.
So this is a mistake that many traders make.
Don't buy high for the sake of buying high – don’t chase the markets.
Let me share with you what you should do instead...
Wait for a buildup to form
What is a buildup?
A buildup is a:
- Tight consolidation (squeeze) on your chart
- Flag Pattern
- Ascending or Descending Triangle
Let me illustrate.
Tight consolidation (squeeze) on your chart
Let’s say the market is in a range.
Then this nice tight consolidation is what I call a buildup.
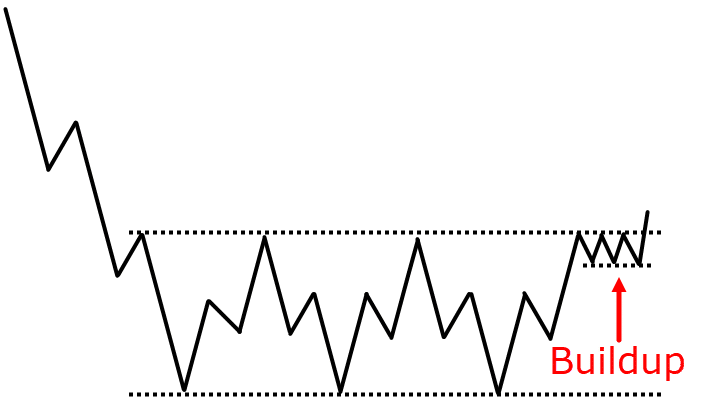
A buildup can occur:
- At the highs of resistance
- After the prices breakout
- Ascending or Descending Triangle
There are different variations to it.
But the key aspect is this:
A buildup is a nice tight consolidation.
I'll explain why I look for a buildup later on.
A buildup can also be in the form of a flag pattern and even ascending or descending triangle.
Flag pattern
A flag pattern will look something like this:
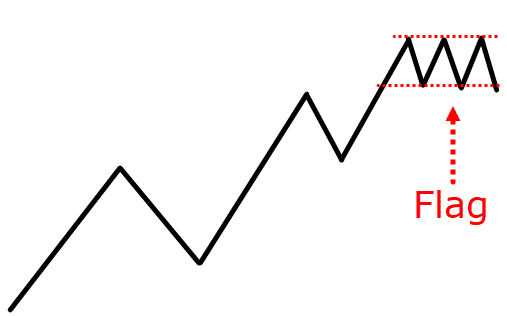
Let’s say the market breaks out of the range and a flag pattern will be forming a buildup.
Usually, the range of the candles is relatively small in a buildup.
You’ll notice the range of the candles is nice and tight.
The tighter it is, the better.
You don't want to see those type of strong reversal moves lower with large momentum candles.
That's not what I call a buildup.
A buildup is usually nice and tight.
Ascending triangle
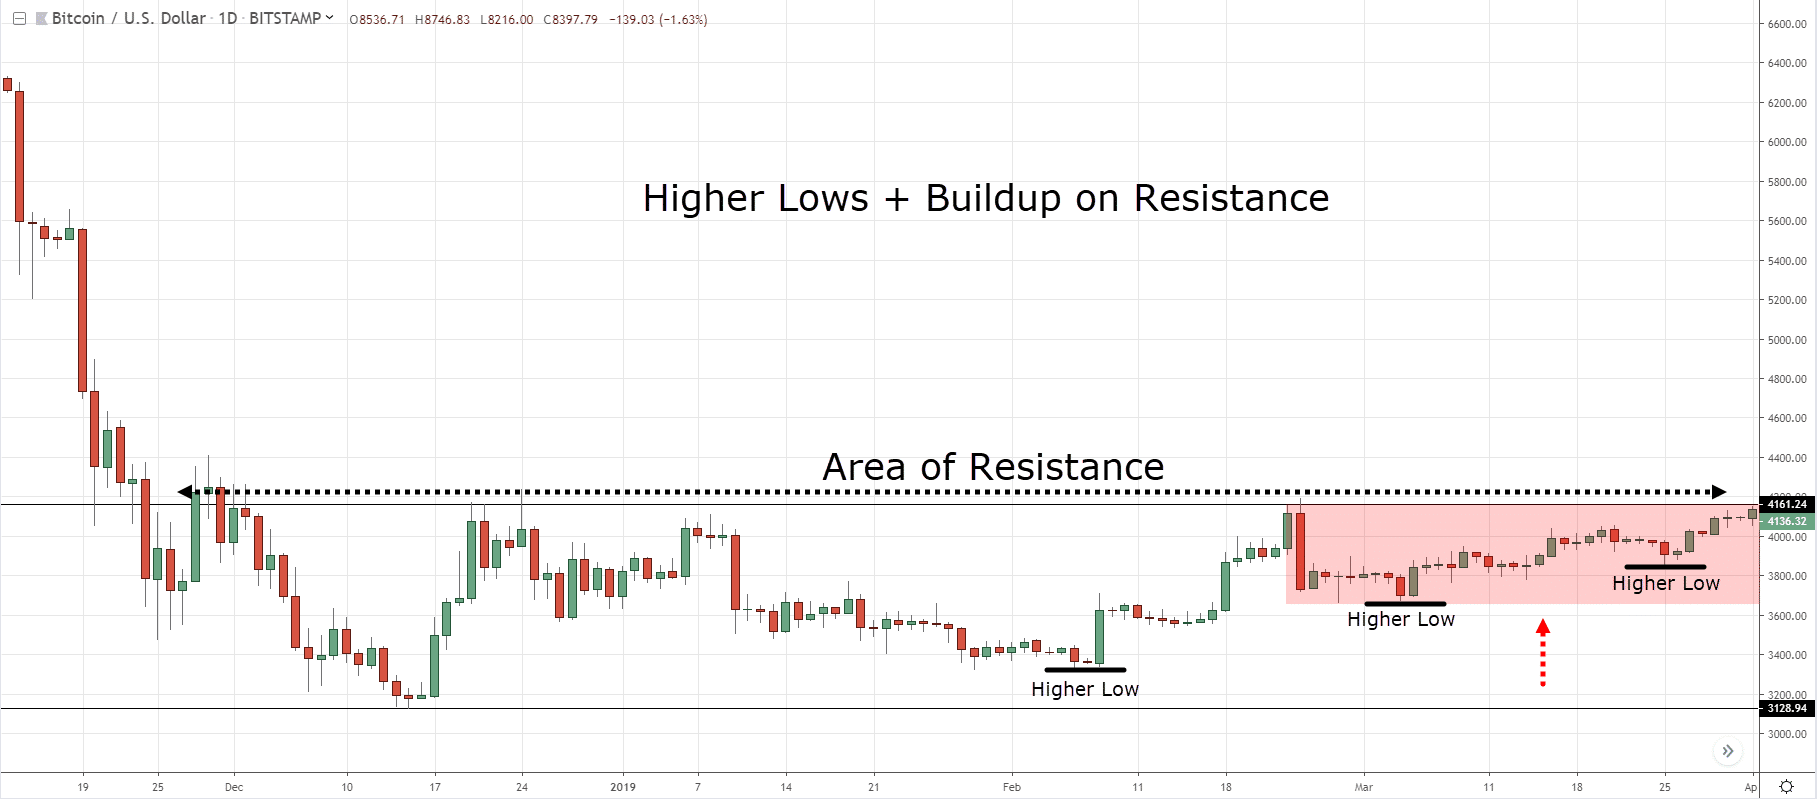
It can also be in the form with of ascending triangle.
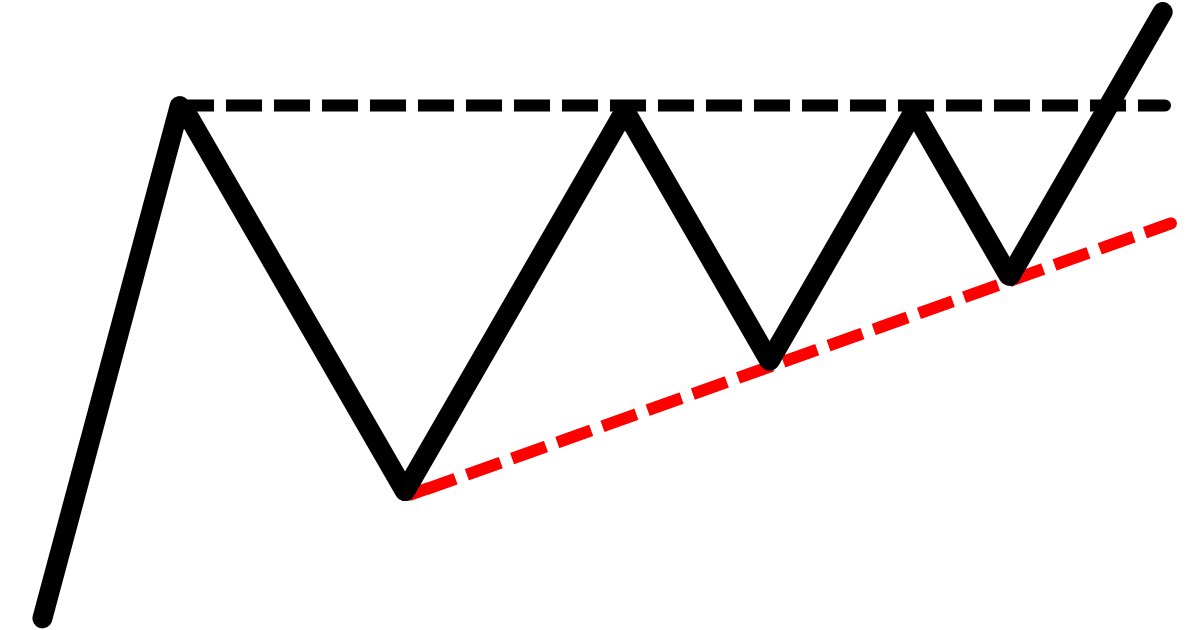
You can see that there’s a series of higher lows coming into this area of resistance,
This is another variation of a buildup because the range of the candle is getting tighter and tighter.
(Descending triangle is just the opposite of the ascending triangle.)
Next…
Why you should wait for a buildup
Here’s why:
- It improves your winning rate
- Higher R multiples on your trade
I’ll explain…
Example #1: Bitcoin
1. It improves your winning rate
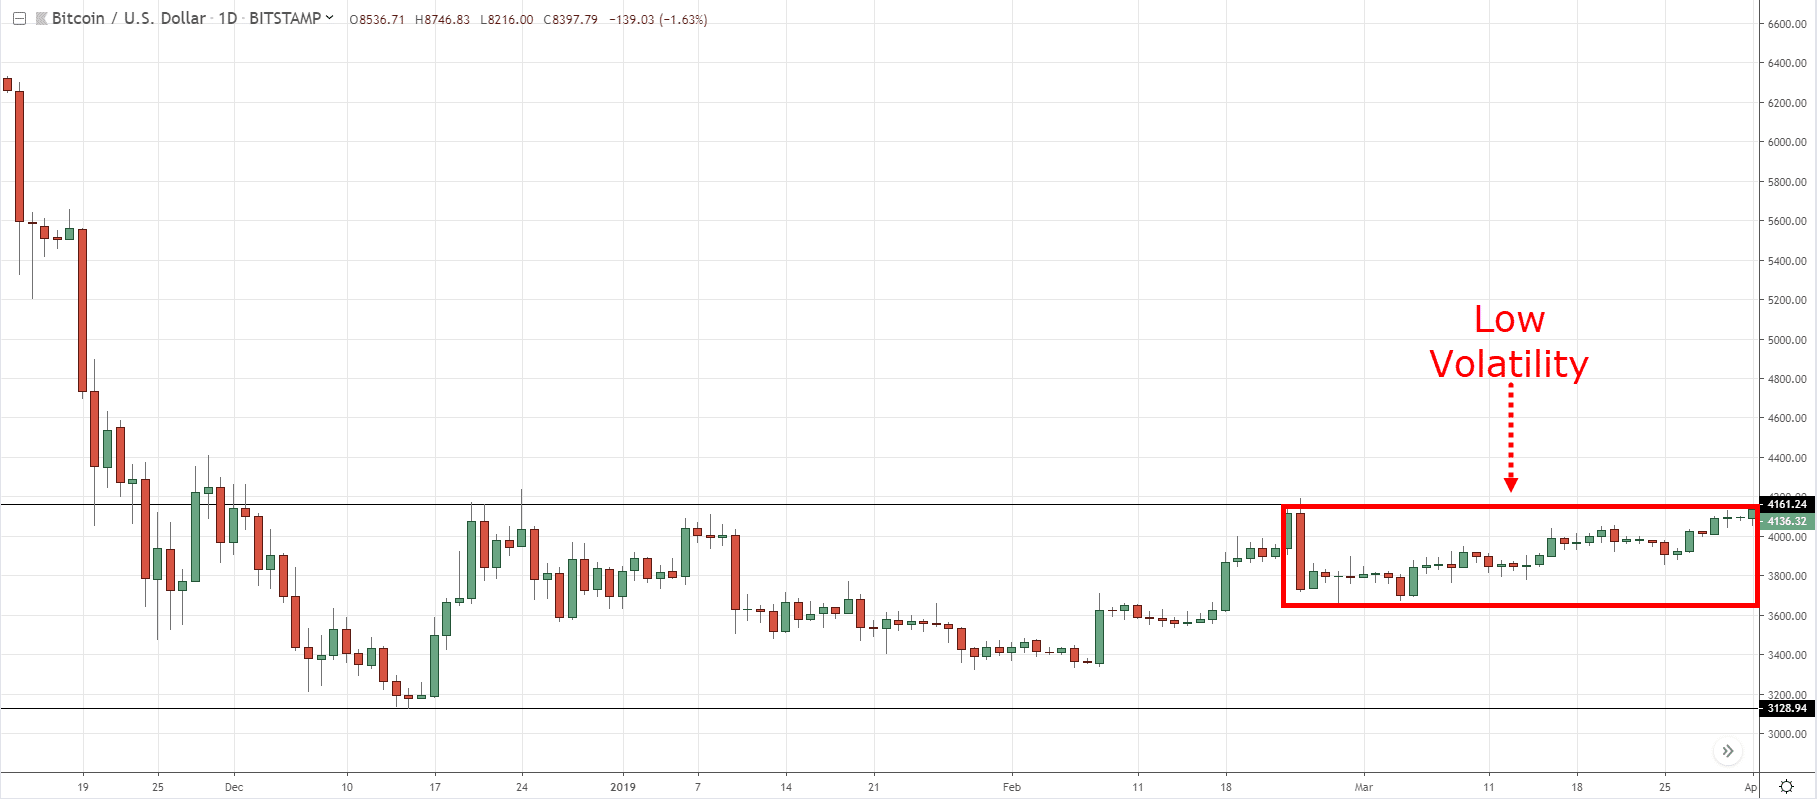
If you look at this buildup:
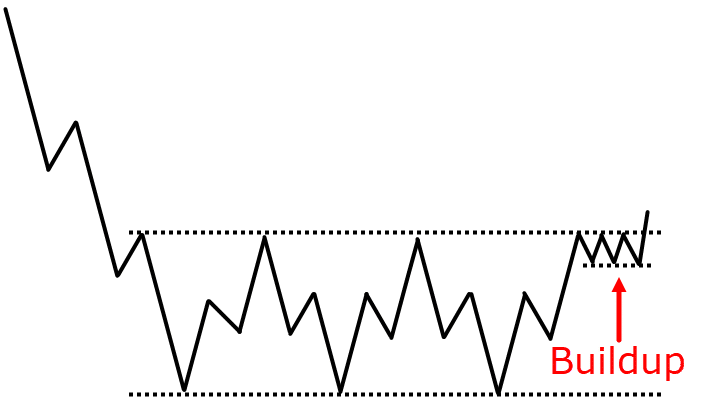
You can see that over here is a nice tight consolidation.
And if you analyze the price action of this, what is the market telling you?
At resistance, sellers should come in and push the price lower.
But the fact that the price is forming a buildup at resistance it means that:
- The selling pressure is not strong that’s why the price can still stay at resistance
- Buying pressure is coming in that's why they’re willing to buy at a higher price
Whether it's the first or second case, it doesn't matter.
What matters is that this is a sign of strength.
If the price breaks out of the highs, the market is likely to continue higher!
Why is it when the price is at resistance that traders would go short?
So where would they put their stop loss?
It will be above the highs.
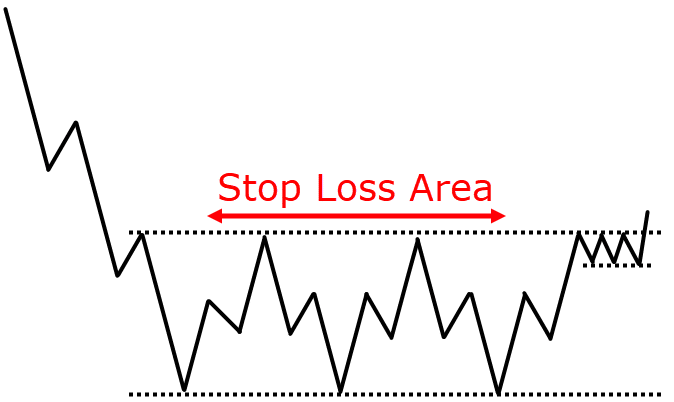
So when the price trades above these highs, this cluster of stop loss (in essence buy stop orders) will be triggered.
This will be the “fuel” to push the price higher.
This is why I look for a buildup whenever I trade a breakout or whenever I look to buy high.
2. Higher R multiples on your trade
I’ll explain.
If you look at this over here:
Notice that the price is making a series of higher lows into this area of resistance.
And in the rightmost edge, the candles really got really tight.
Compare that to the previous trade where traders are chasing the market:
Notice the difference in price action and volatility of the market.
This one is more volatile with large body candles and strong momentum.
Whereas for the one with a buildup, market volatility is low, the range of the candles is small.
You want to trade breakouts and buying higher in a low-volatility environment.
At this point, you're also buying high near the resistance.
You want to be trading this type of trading setup because:
- It's a sign of strength - buyers are willing to come in and about to push the price higher
- Your stop-loss is now at a logical level
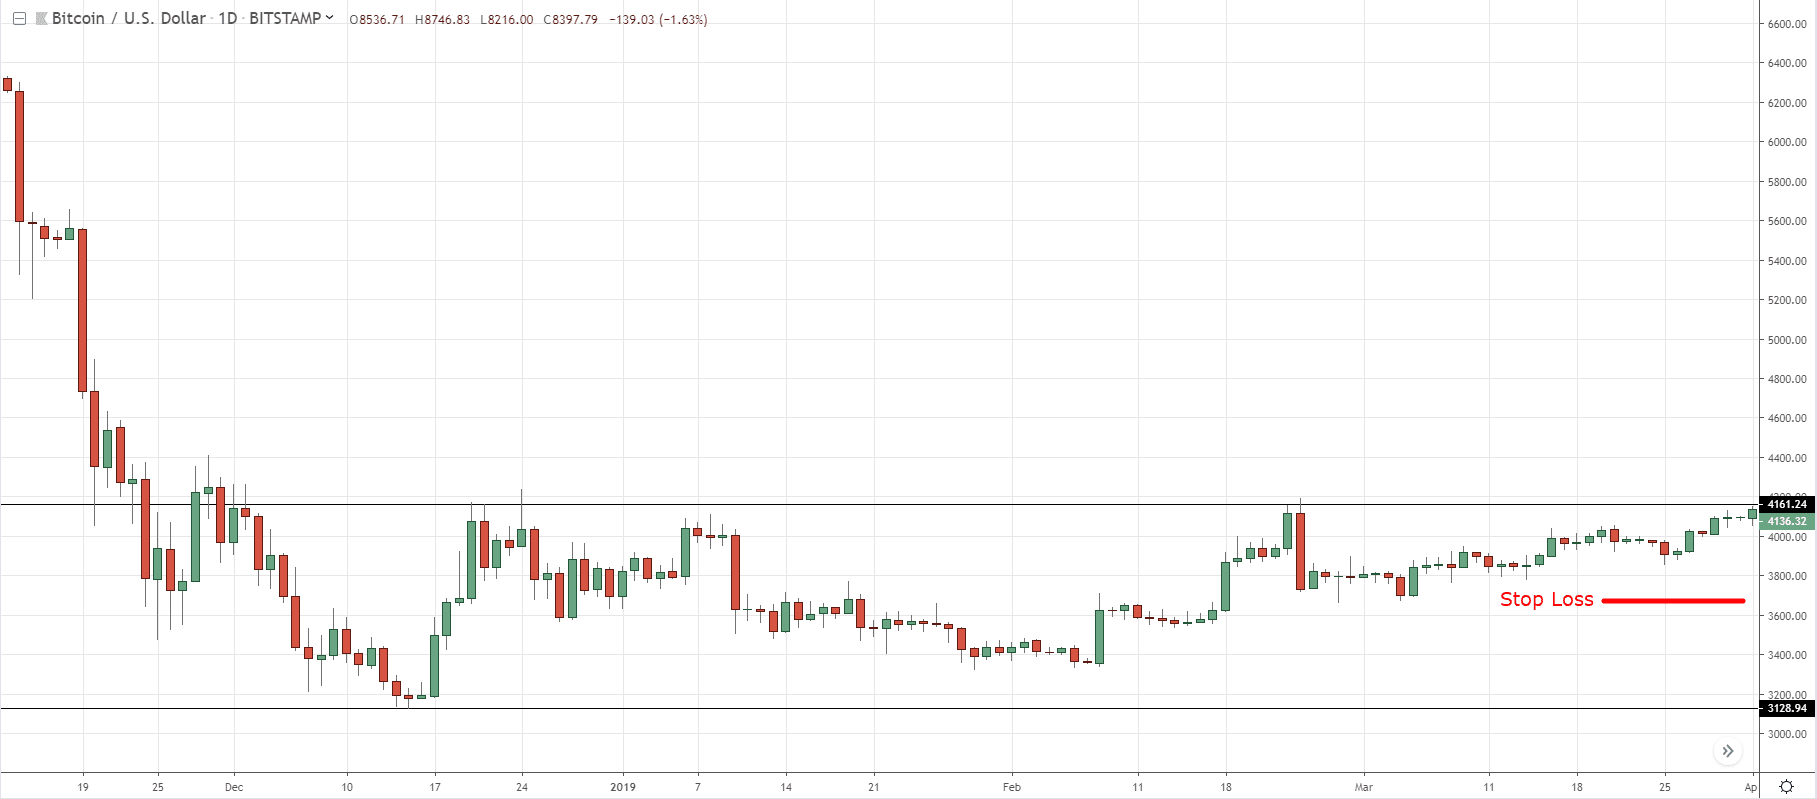
You can just set your stop loss possibly below the swing low:
Can you see the difference in stop loss?
If you buy at $4,200 and place your stop loss at $3,700, that's about a $500 stop loss.
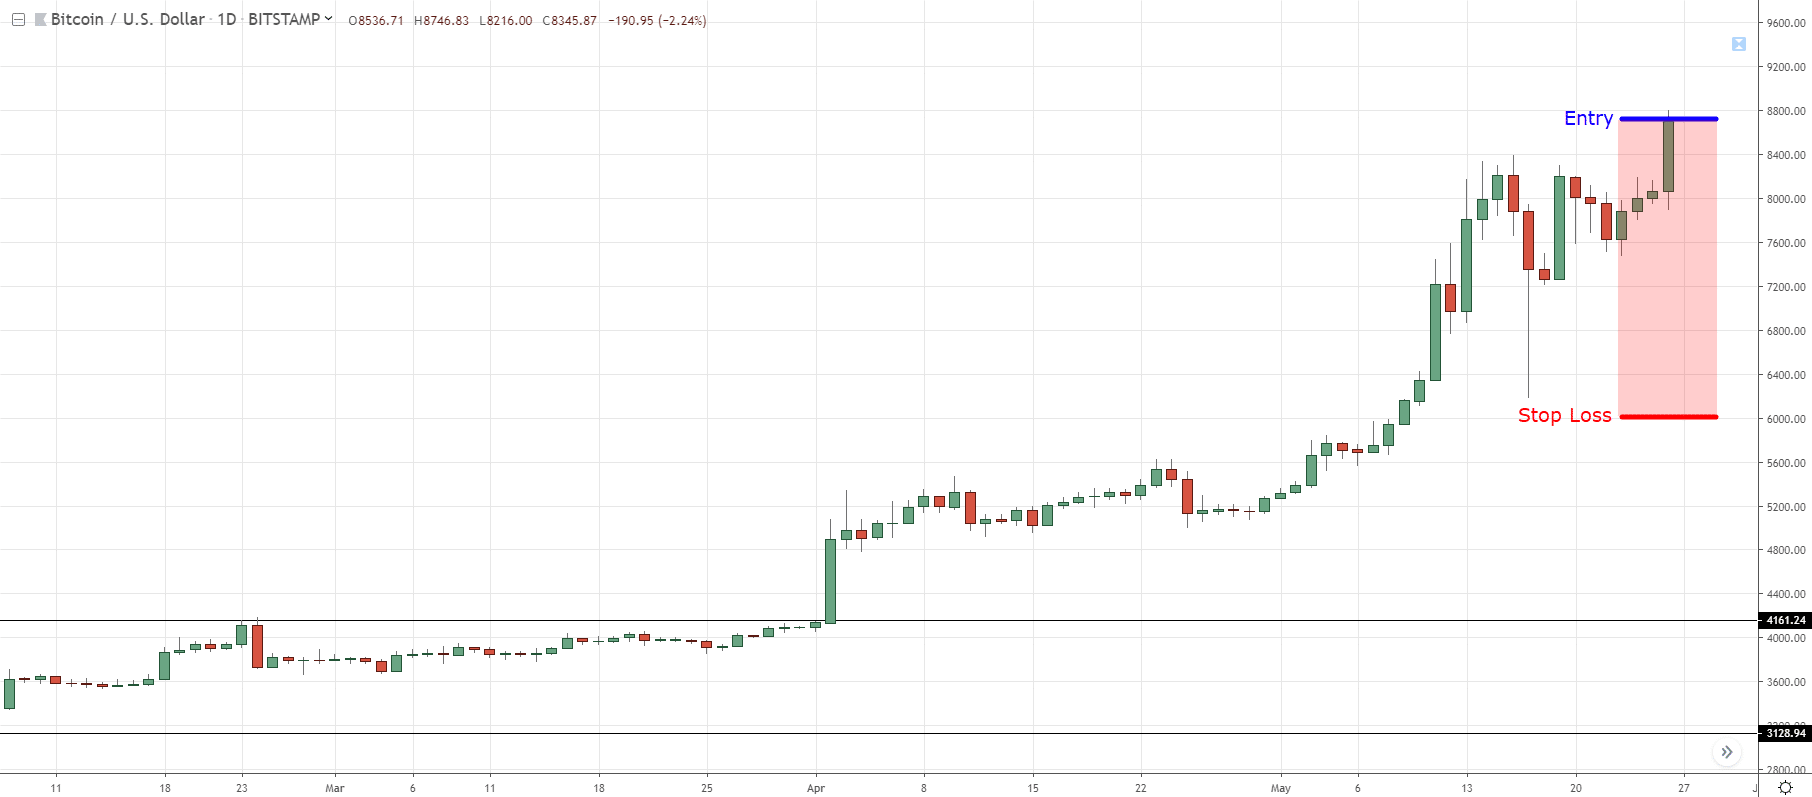
Compared to this one over here where you're chasing the market:
Let’s say you buy at the breakout of the highs at $8,400 and place your stop loss at $6,000 level.
That’s a stop loss of $2,400.
If you buy when the volatility of the market is huge, a logical stop loss will minimally be about $2,400.
Whereas the one with a buildup, the stop loss is just about $500.
What's the implication of this?
So when you trade breakouts with a buildup, your R multiple is more favourable to you.
Because if you think about this, for every $500 the price moves in your favour, that's a profit of 1R.
In other words, a 1 to 1 risk to reward ratio.
If the market moves $5,000 in your favour, that's a risk-reward ratio of 1 to 10.
On the other hand, when you buy after volatility has expanded and your stop loss is $2,400…
A $5,000 move by the market is only a risk to reward ratio of slightly more than 1:2.
So if your stop loss is huge, you’ll need the market to move in your favour more, before you earn a 1 to 1 risk to reward ratio.
This is the difference between trading with a buildup and just blindly chasing the markets.
So trading with buildup:
- Improves your winning rate
- Improves your R multiple on your trade
Let me share with you another example.
Example #2: Brent Crude Oil
You can see that Brent Crude Oil has a buildup over here with a series of higher lows: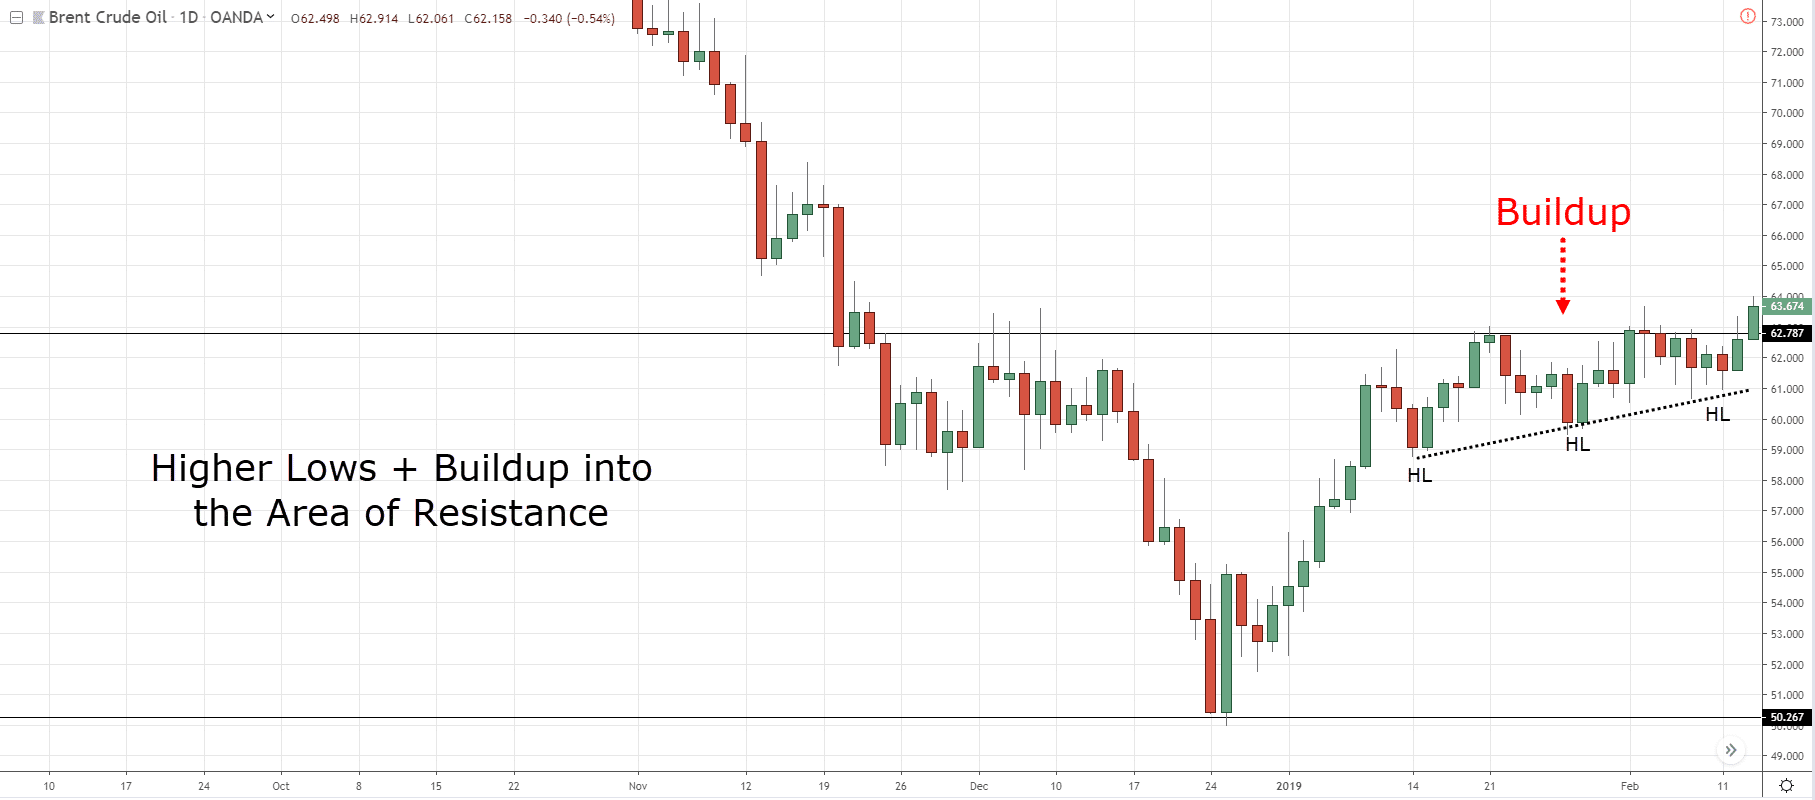
If you analyzed this closely, there's a series of higher lows coming into these highs as well.
Somewhat like an ascending triangle.
This is a nice tight buildup.
So you want to be buying the breakout of the highs.
This is much better than just chasing the markets blindly where you don't have a reference point to set your stop loss.
Example #3: GBP/JPY
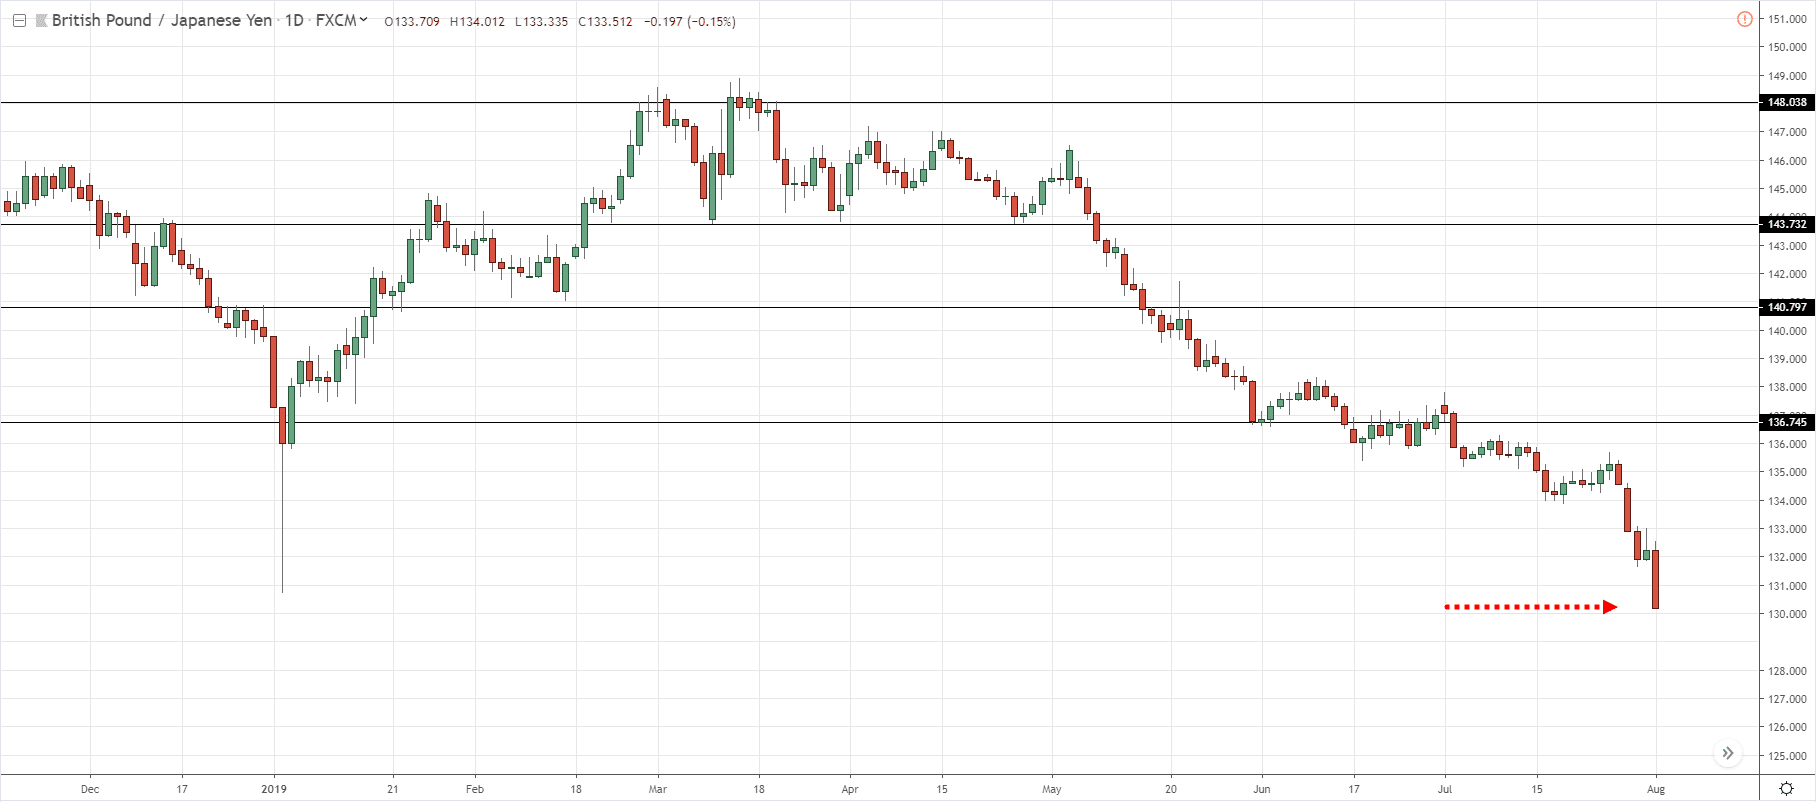
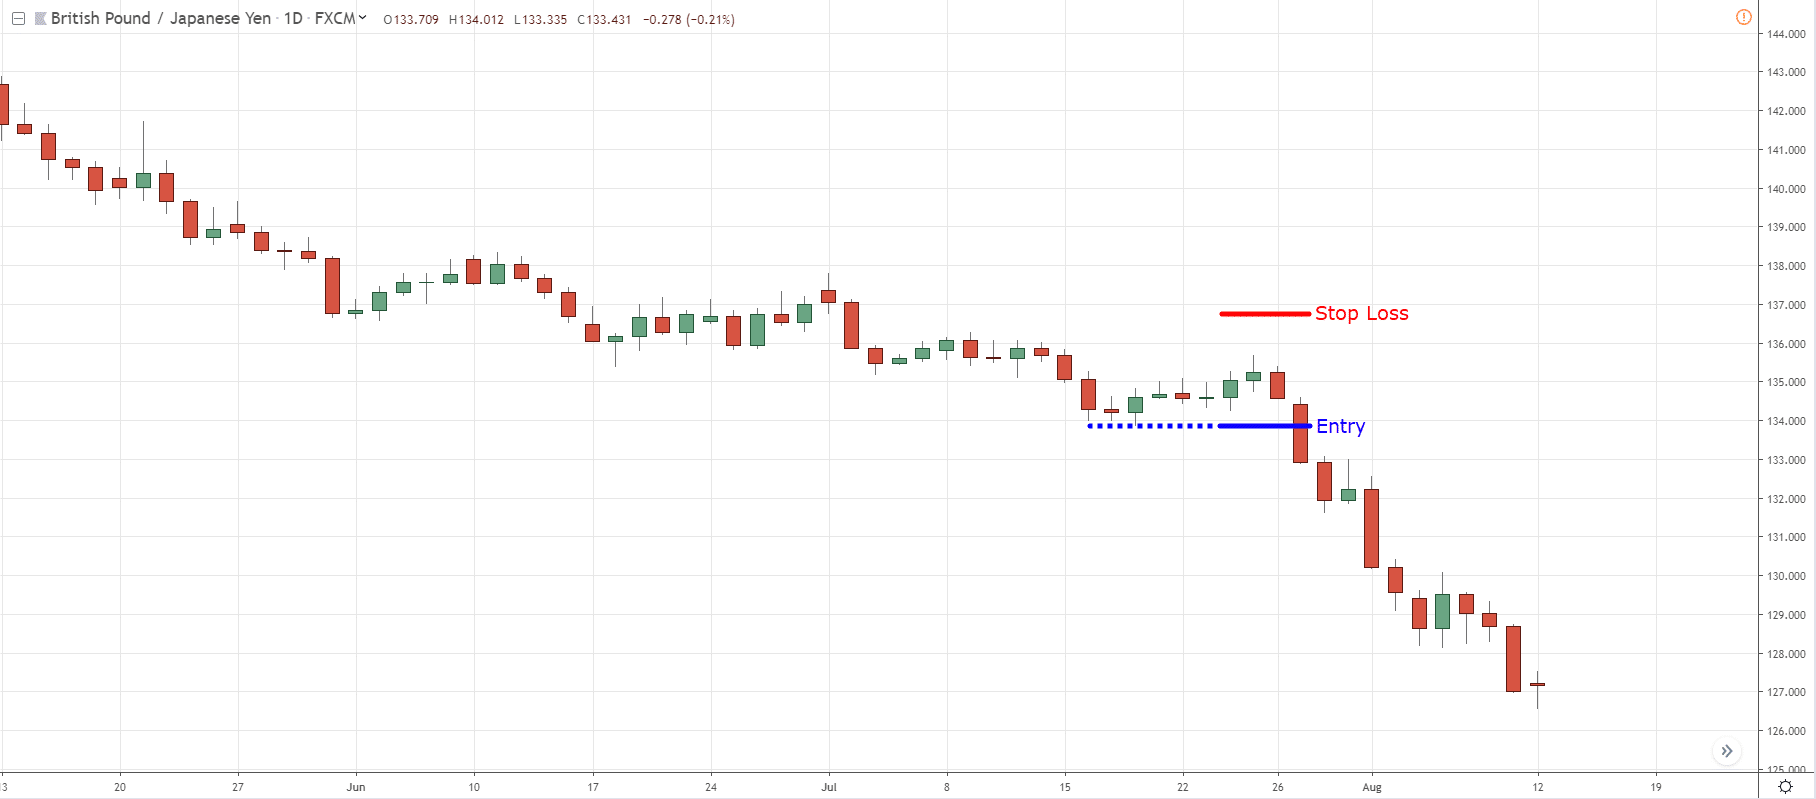
This one here is the GBP/JPY:
At this point, let me ask you:
Will you want to be shorting in this market?
I hope you said no.
Why is that?
If you're going to be selling right now, where is a logical place to put your stop loss?
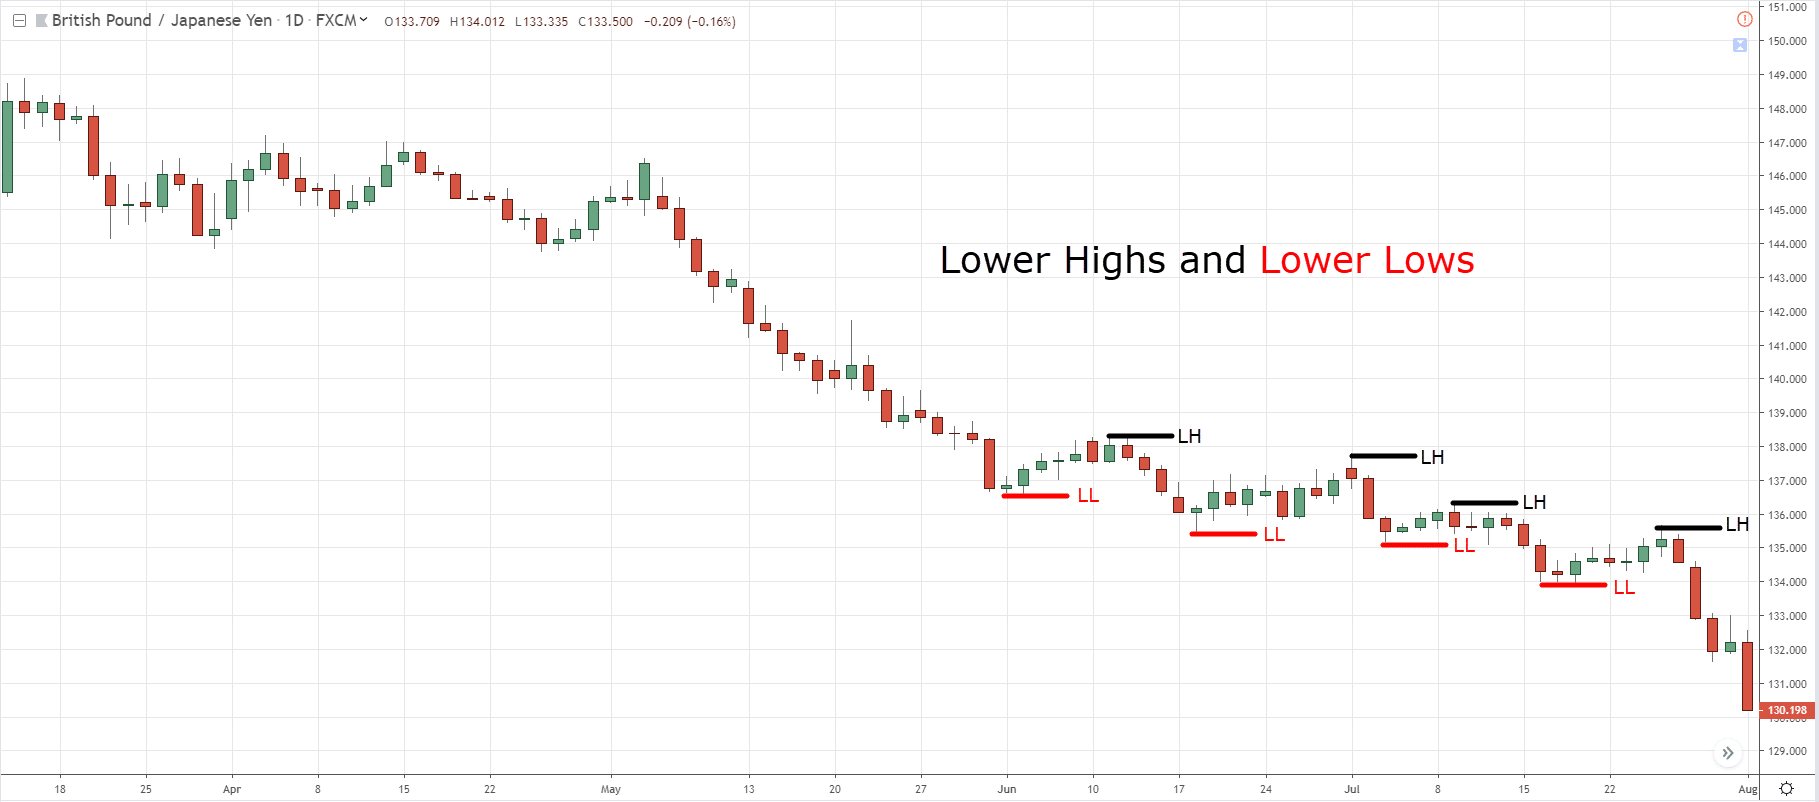
Well, technically this in a downtrend and it’s making a series of lower highs and lower lows.
So if you want to set your stop loss, it should be slightly above the previous swing high.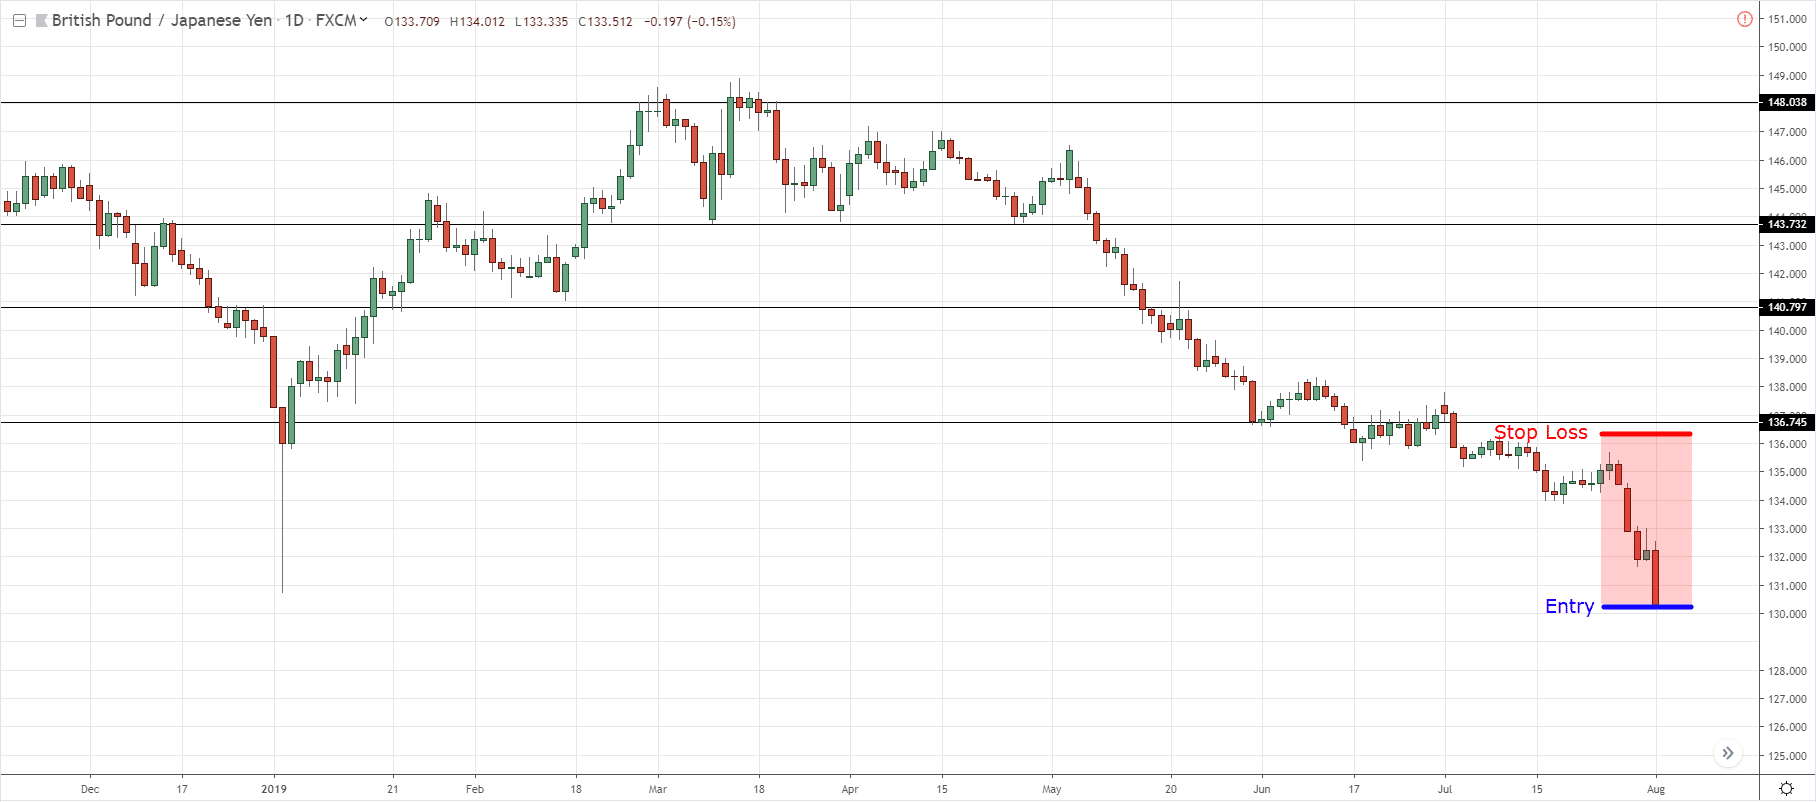
This will be the size of your stop loss.
And as you've seen earlier:
The larger your stop loss, the more the market has to move in your favour to earn a 1 to 1 risk to reward ratio.
Do you want to do that?
Nah.
So…
Wait for a buildup to form.
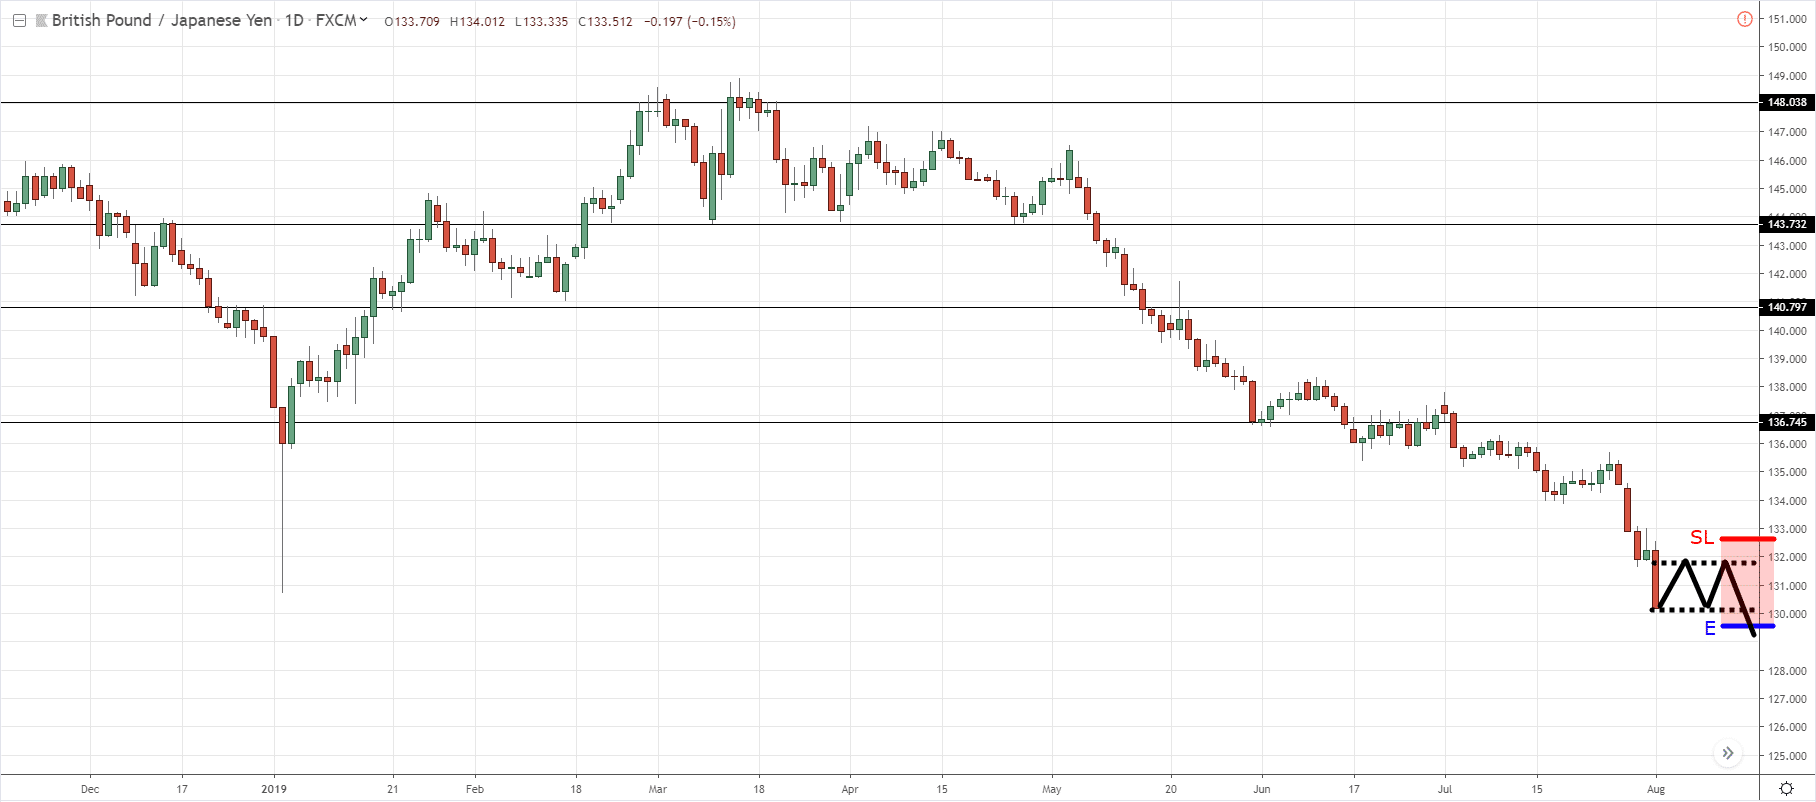
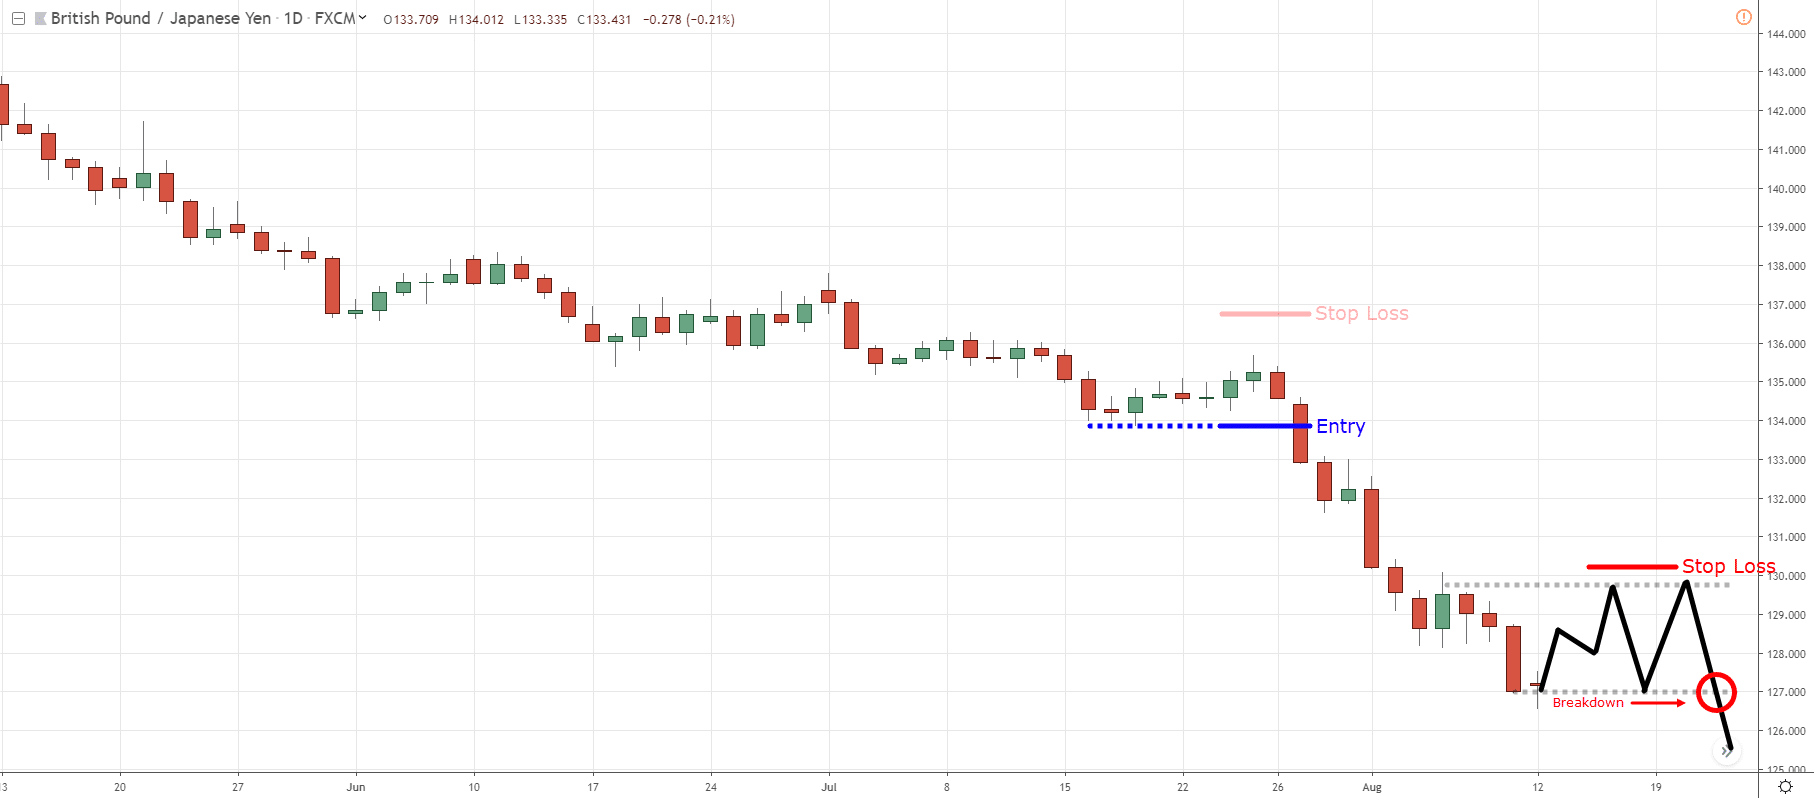
If market forms as buildup and then breaks down lower:
You’ll have a more logical level for your stop loss at the previous swing high.
Your stop loss will be much tighter and is a more favourable risk to reward for your trade.
The market doesn't need to move a lot for you to earn a 1 to 1 risk to reward ratio.
So this is what I mean by waiting for a buildup to form.
You’ll have a logical level on your chart to set your stop loss nice and tight.
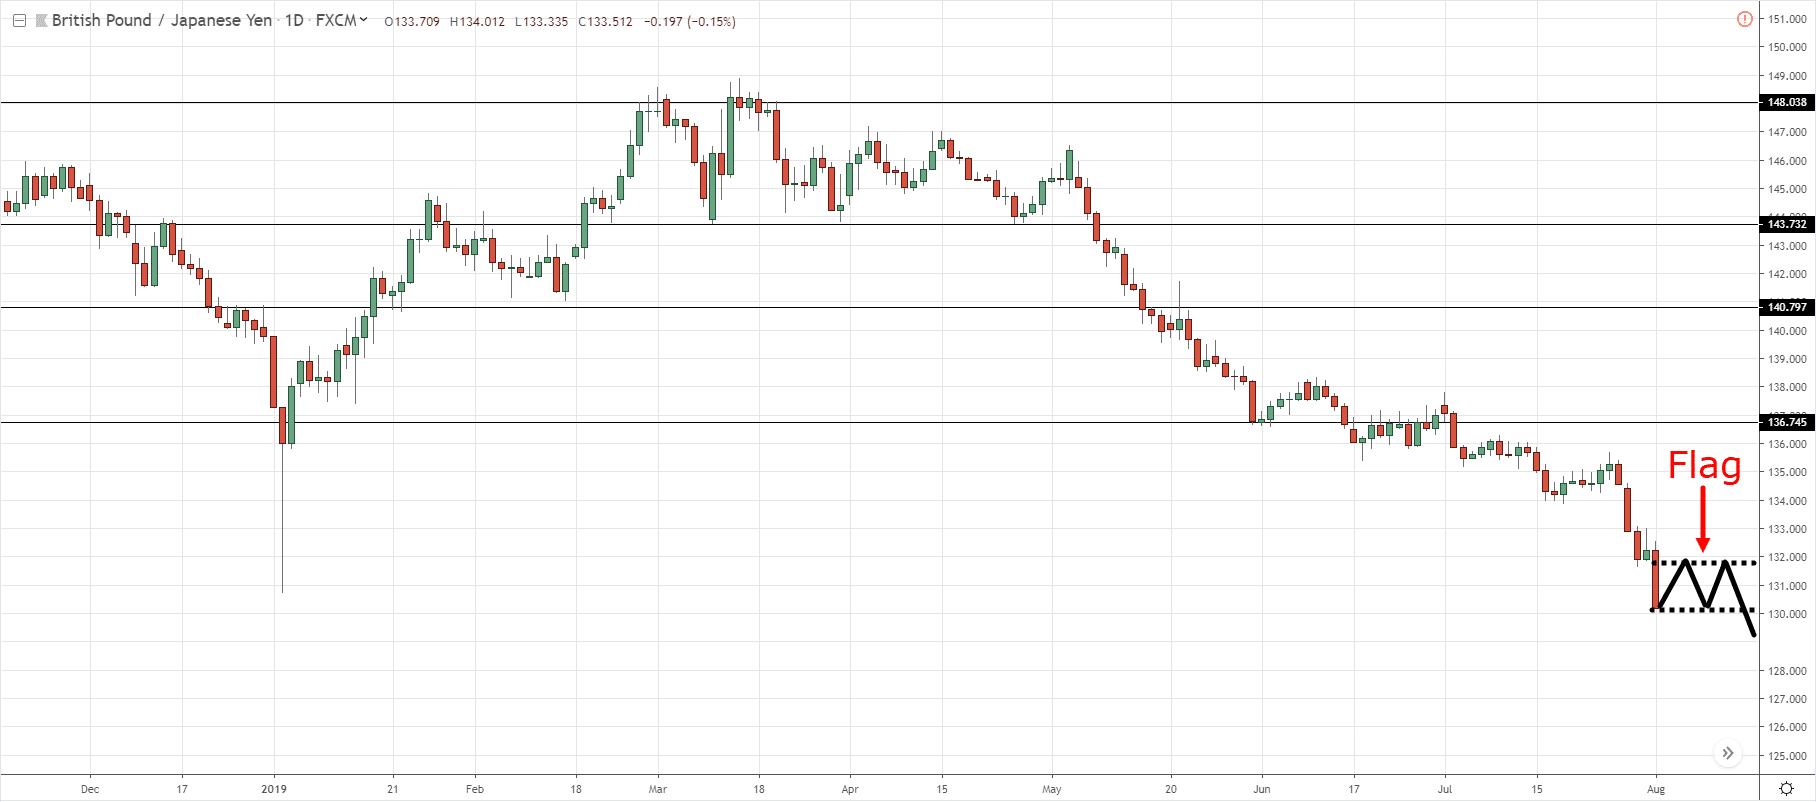
Back to the GBP/JPY example, if you see somewhat of a bear flag pattern over here:
It means that the buyers are unable to push the price up higher.
The sellers are willing to sell at these lower prices to contain the prices.
This is clearly a sign of weakness as buyers are unable to push the price higher.
So when you wait for a buildup to form…
You’re “confirming” that sellers are still in control and you’ll look to short the market on the breakdown.
Moving on…
Trade exits
So how do you exit your trade?
Usually, when you’re buying high and selling higher, the market has already spoken.
It’s in an uptrend.
If in a downtrend in this example, you’ll want to ride the move for all it's worth.
You can trail your stop loss according to:
- Market structure
- Moving average
Let me explain.
1. Market structure
Let’s use the GBP/JPY Example.
You can see that the market is now in a series of lower highs and lower lows.
One very simple technique to trail your stop loss is based on market structure.
In a downtrend, the market tends to make lower highs and lower lows.
What you can do is set your stop loss above this previous swing high:
And then let the market continue to work for you.
If it retraces only to come back down lower, you can reference the swing highs to set your stop loss:
So this is what I mean by using the market structure.
2. Moving average
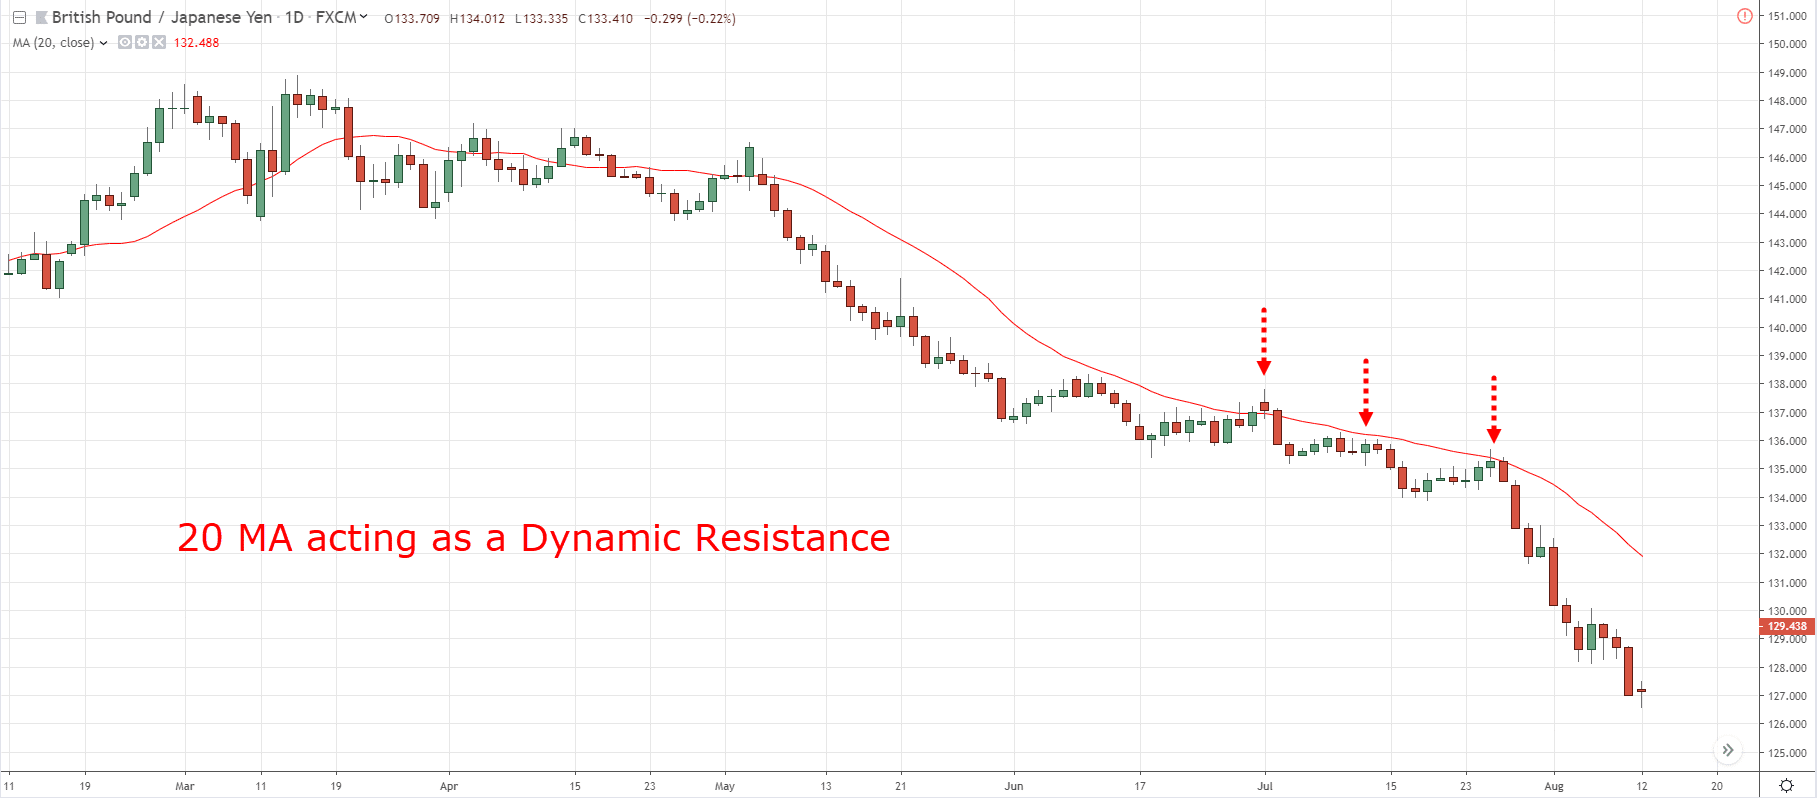
Moving average acts as a dynamic support resistance in a trending market.
The 20MA on the GBP/JPY acts as a dynamic resistance where the price tends to bounce off the moving average.
If it comes back and tests for the third time, it could bounce off from it again.
So you can use this moving average to set your stop loss a distance away from it.
These two techniques will help you to ride the downtrend lower.
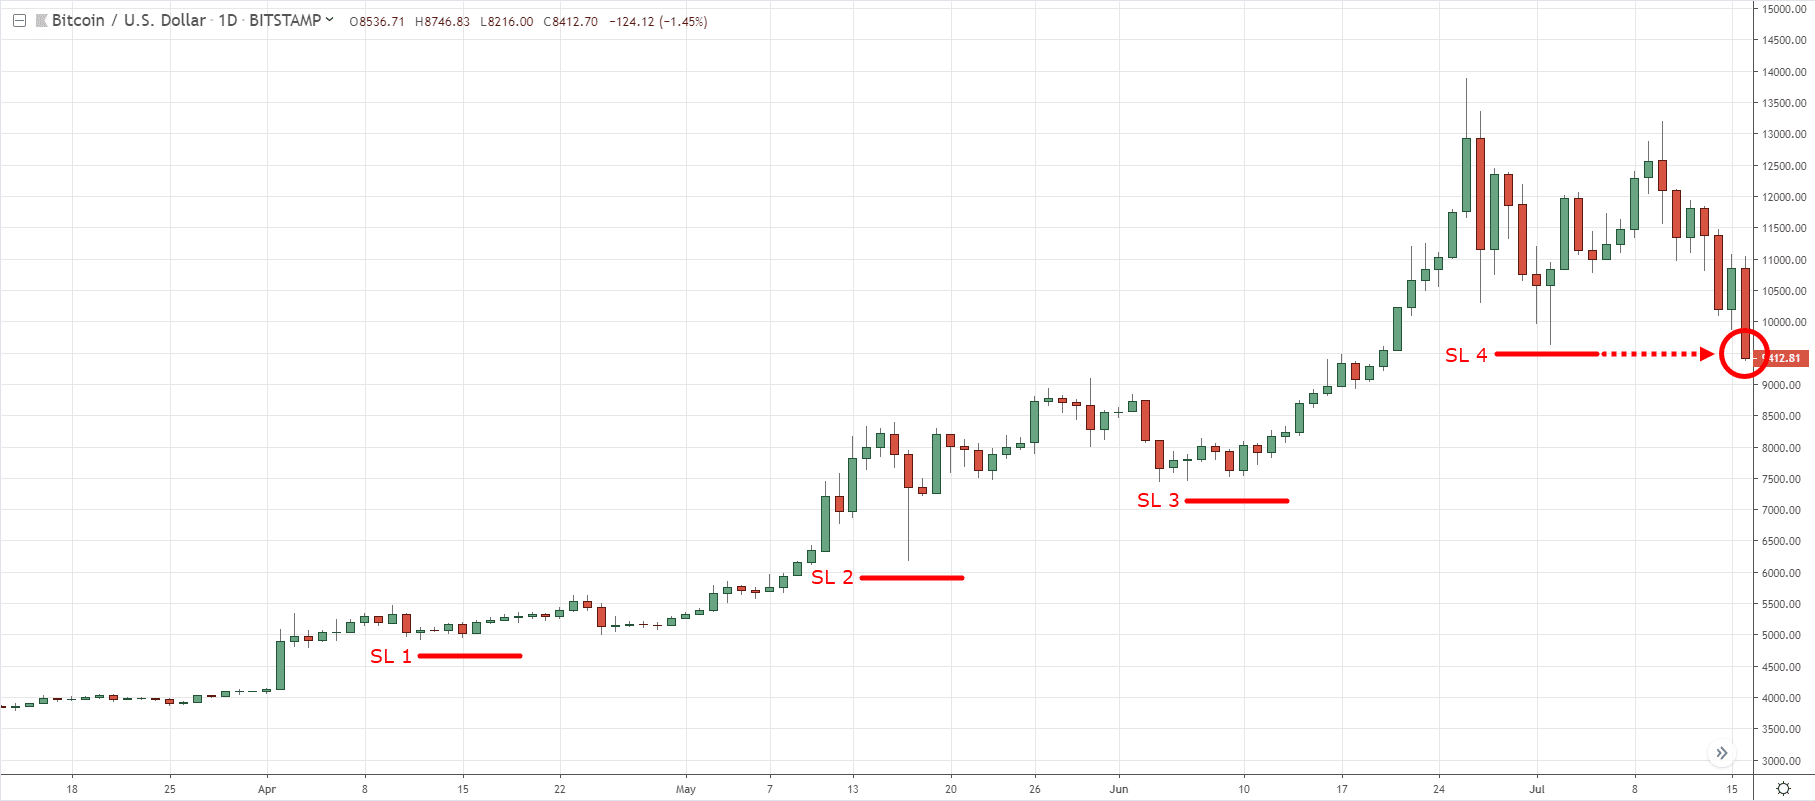
In the Bitcoin example…
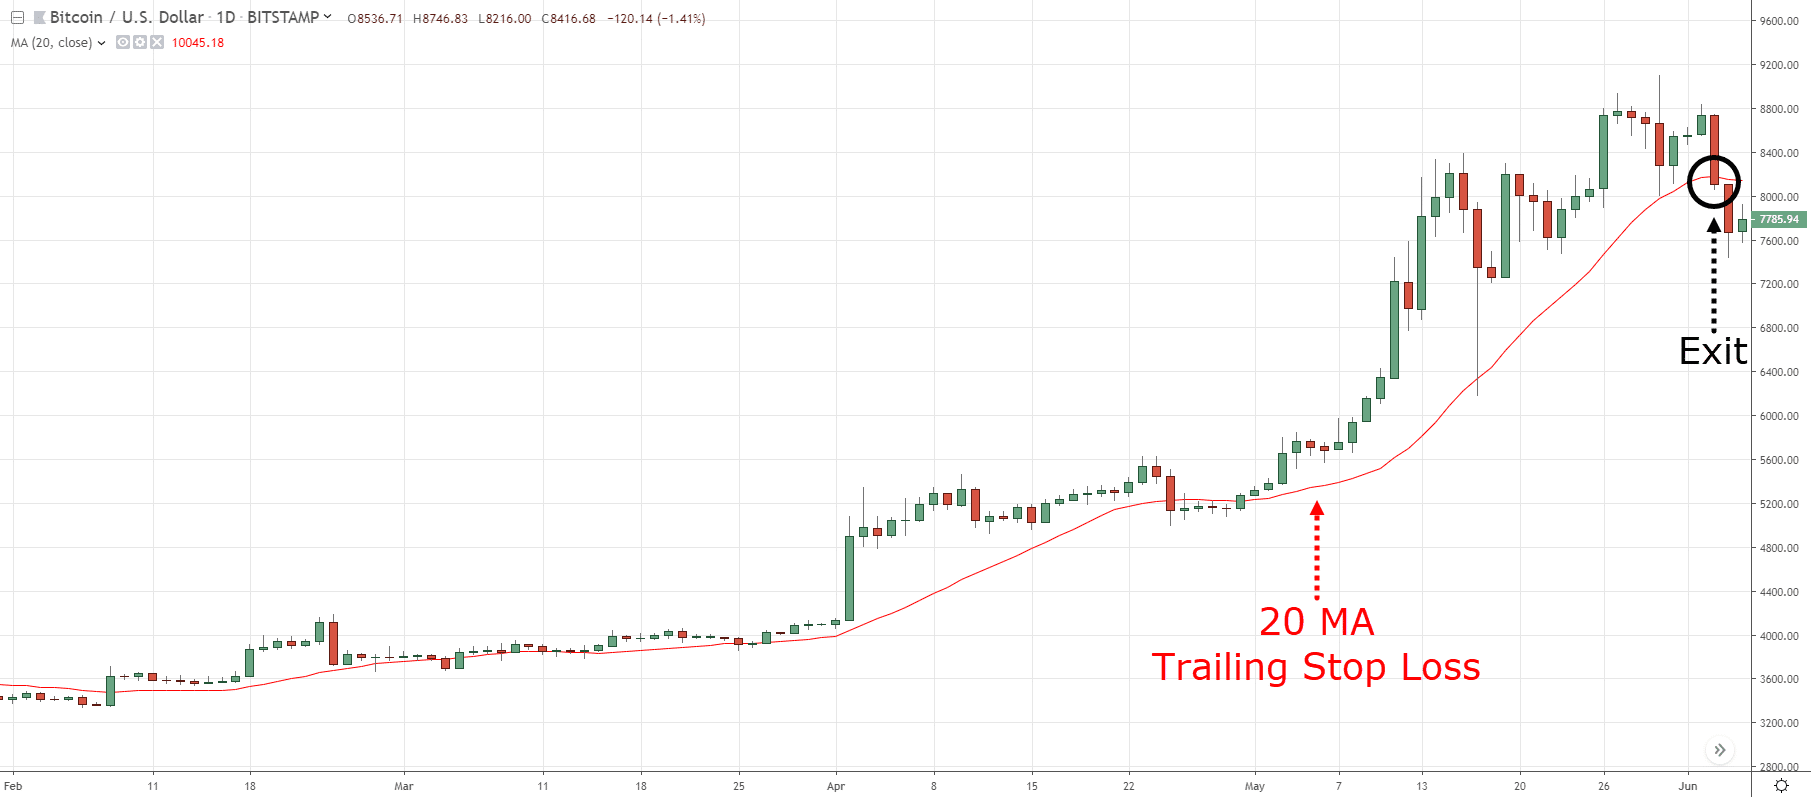
You can trail your stop loss below the swing lows to ride the uptrend:
You can also use the 20MA to trail your stop loss:
So these are the things that I want to share with you when it comes to buying high and selling higher.
Now let's do a quick recap…
Recap
- Don't “chase” breakouts – you won’t have a logical place to set your stop loss
- Trade breakouts with a buildup – to get a reference level for your stop loss
- Trail your stop loss to ride the trend – using moving average and market structure

