#9: How To Combine Trading Indicators Like A Pro
Lesson 9
In today's training, you will learn how to combine trading indicators like a pro, so you can better time your entries and exits to get better trading results.
But first…
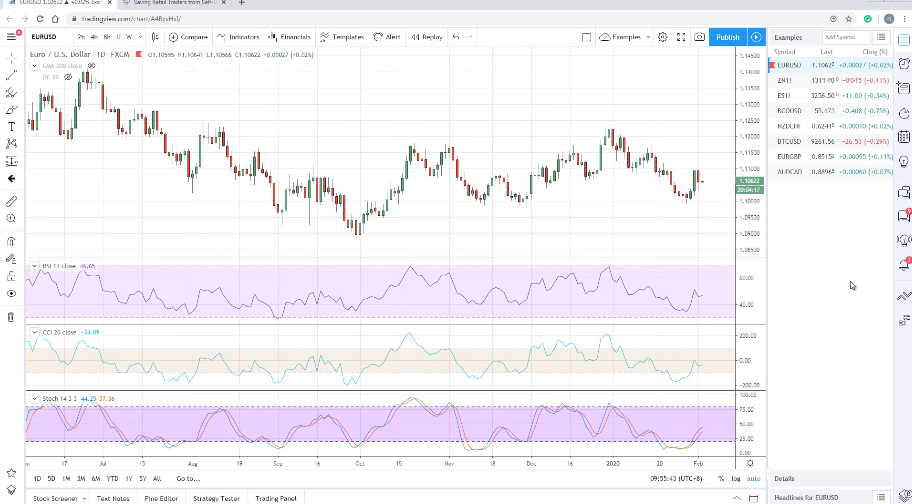
Have a look at this chart over here and tell me what's wrong with it.
For some of you, you may be thinking:
“Hey Rayner, there’s nothing wrong with this man.”
“This looks good. Look at the signal of this chart, the market is going up higher. Look, this RSI is pointing higher, the CCI is pointing higher, the stochastic is pointing higher!”
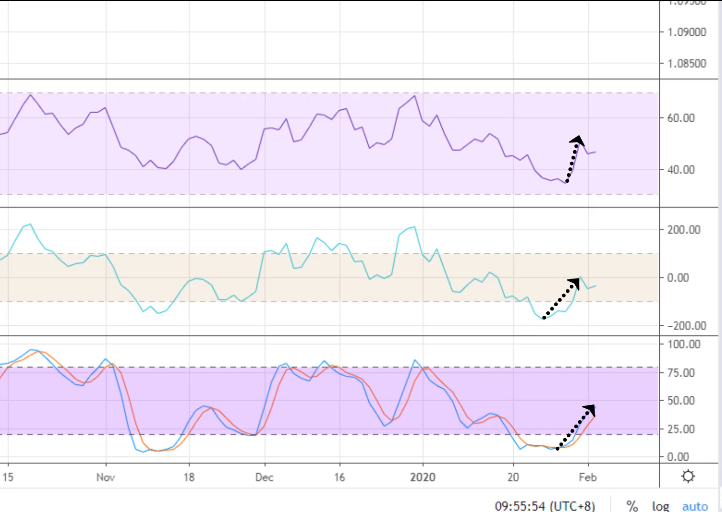
“Oh, this market is bullish is going up for sure.”
The problem with this chart is that this group of indicators are correlated.
They are known as oscillators. The way they are calculated and the logic behind these indicators are largely similar.
That's why these indicators, they all move correspondingly because they're correlated.
It's not because the signal is strong, it’s not because the market is about to go up higher, it’s not because this is a high probability trade, but rather this group of indicators behave similarly.
When one goes up, the other goes up as well. When it goes down, this other one goes down.
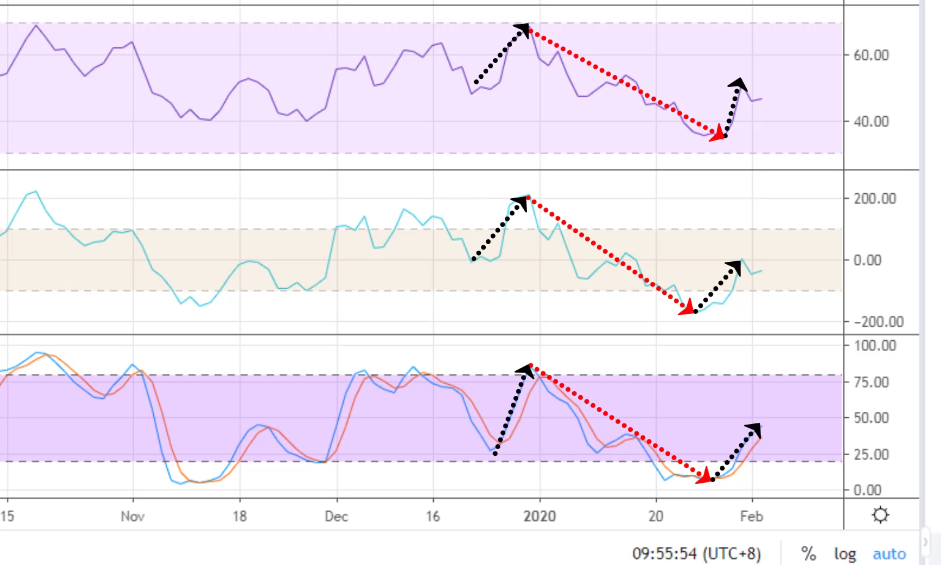
This is a mistake that many traders make when they use indicators. They just splash it all over their chart, all pointing in the same direction.
“Oh, this is a high probability trade. Let's buy, buy, buy!”
Then the market reverse, they get stopped out, and you wonder why all these indicators are saying the same thing.
You can’t just splash any indicator like that on your screen. It doesn’t add value to your trading it just adds cluster to your trading.
Having more indicators on your chart doesn’t mean you are going to get a better interpretation of the chart. You're not going to get a better analysis. It doesn't work that way.
It’s like trying to get your wife pregnant, you can fire 1 time, 10 times, 100 times, but it’ll still take nine months for a baby to come up.
It doesn't mean that you if fire 500 times, the baby will come up in one month.
It doesn't work okay.
The more indicators that you hit your chart with doesn't mean it's better. You have to know what you're doing.
Now the question is:
How do I combine trading indicators such that it adds value to my trading and makes sense?
That's what we're going to cover now.
How to combine trading indicators
The way I do it is that I like to categorize them for their purposes.
Some people like to categorize indicators by categories like oscillators, volume, trend indicators, etc.
I like to categorize them by their purpose.
And the way to do it is that you have to know the math behind all these different indicators and the logic behind it to make life easier.
I have broken down most indicators right into one of these four purposes:
- Market condition
- Area of value
- Entry trigger
- Trade management
Let me explain.
1. Market condition
What you want to do is that. Identify the trend and whether the market is in a range. And if the volatility is low or high.
There are many indicators for this but to simplify this I’m only using the moving average and the average true range. Because I just want to illustrate the concept to you.
Moving average
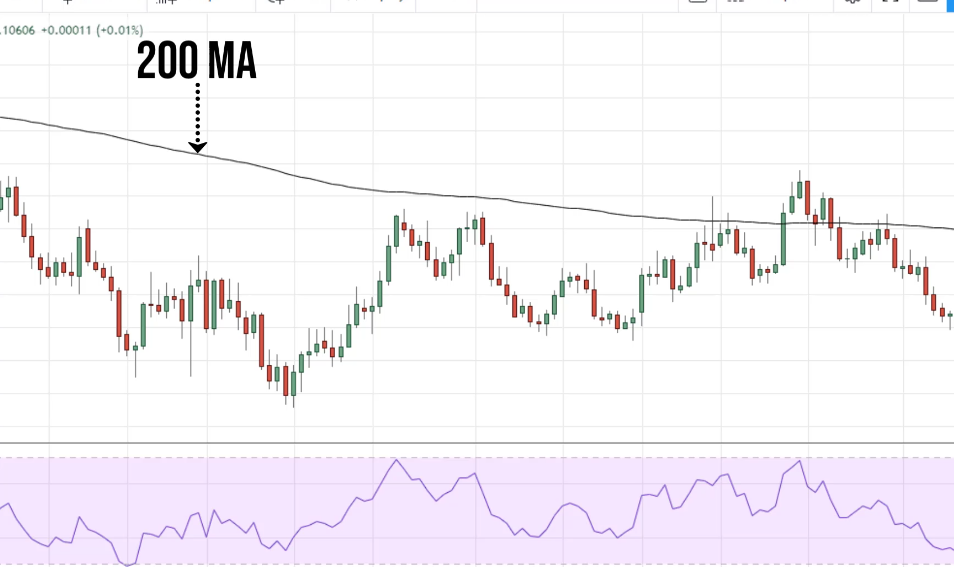
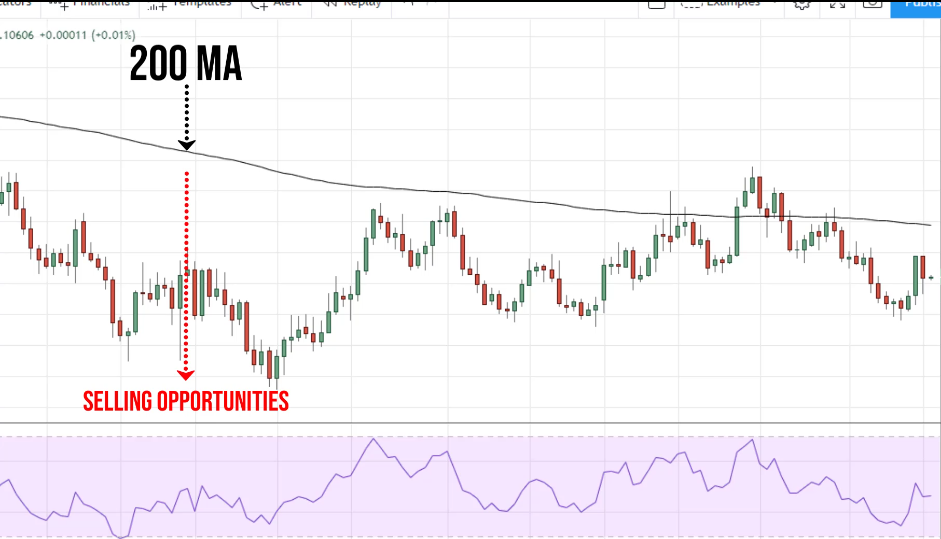
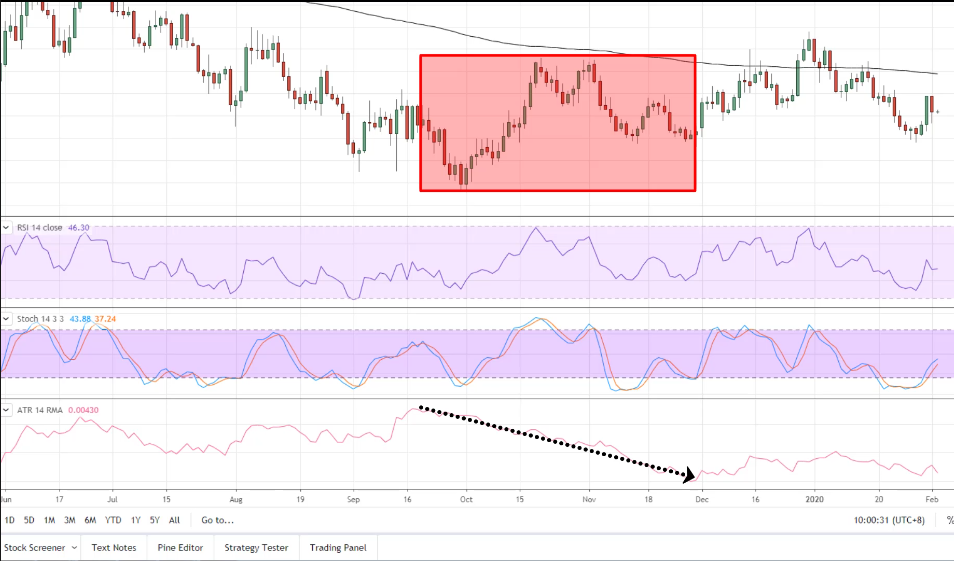
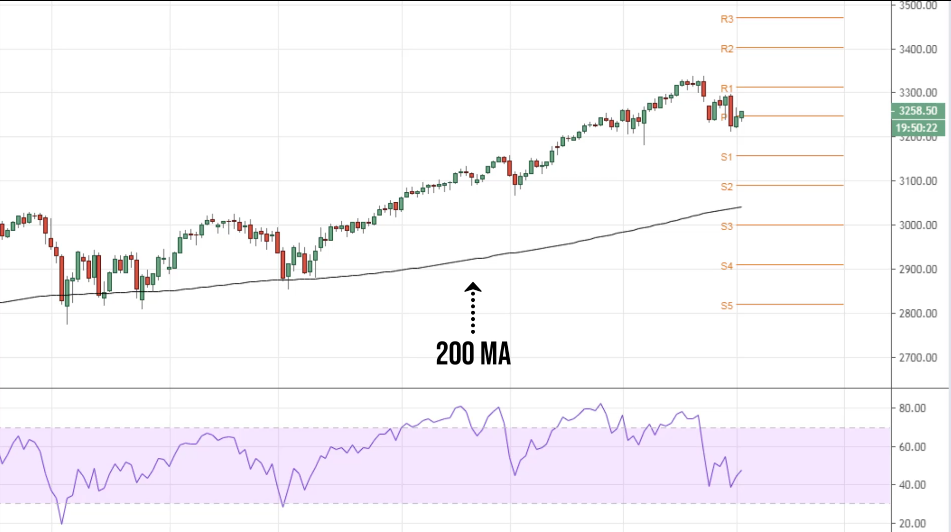
The black line over here is the 200-period moving average. What this does is it measures historical prices.
It sums up the historical prices over time.
If prices have been falling it will calculate the average rate over the last 200 periods and plots it up as a line on your chart.
If the prices have been falling over the last 200 periods, the moving average will be pointing lower.
You can use this as an indicator to tell you whether the market is trending higher or lower.
One way to go about it is that if the price is below the 200-period moving average, you can see that the overall market is in a downtrend.
You want to look for selling opportunities like this one over here.
Generally, the price is below the 200-period moving average. Then you want to look for selling opportunities and the opposite is true.
If the price is consistently above the 200-period moving average, you want to look for buy opportunities.
Average true range
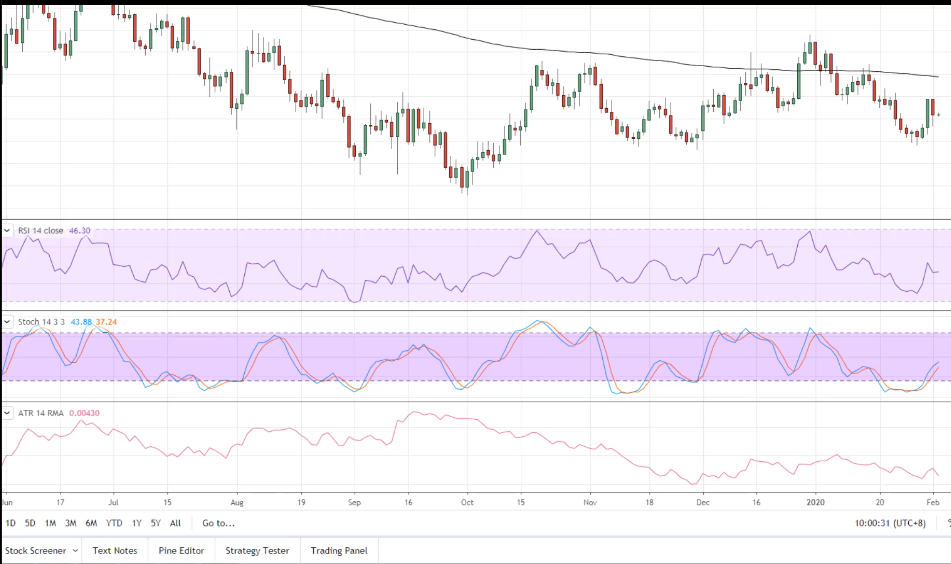
You can get out the average true range.
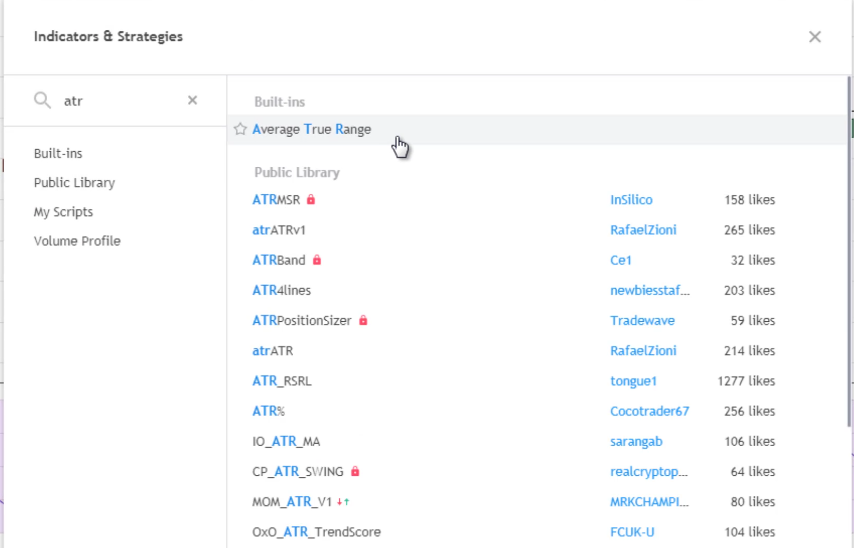
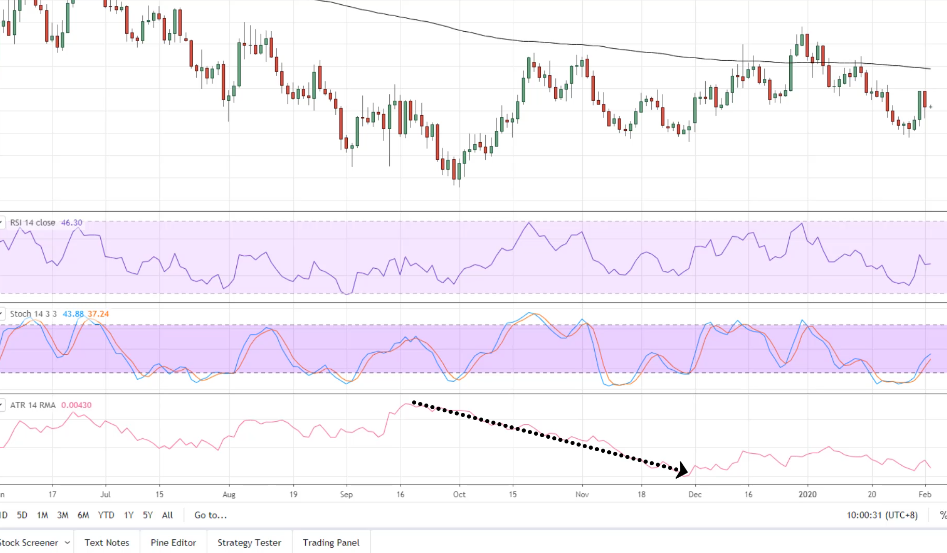
You can see that this indicator, the ATR is not correlated with stochastic and RSI.
The reason is that they are of different purposes, ATR measures the volatility of the market, whereas the other two are just an oscillator that oscillates between zero and a hundred.
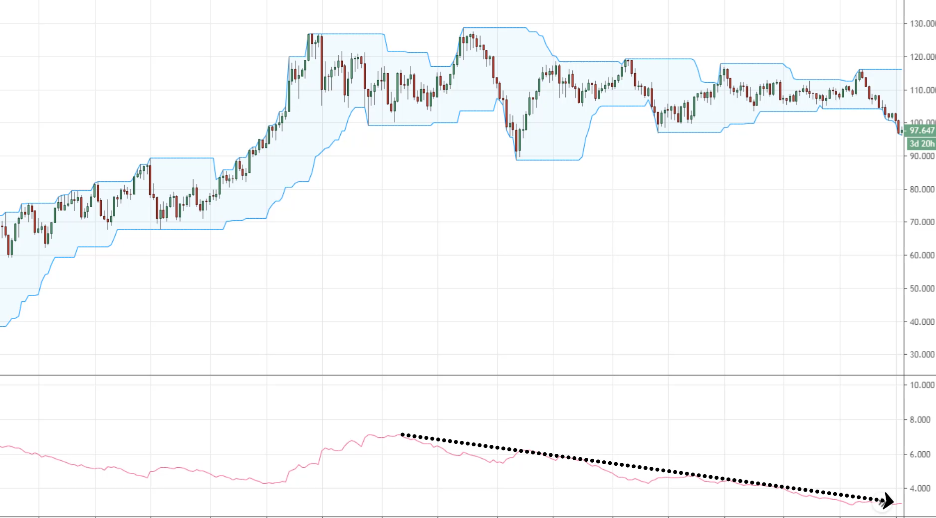
We can see that over here that the line over here is heading low over time.
What does it tell you?
It's telling you that over time that the market volatility is decreasing. It's nothing to do with the trend. It only measures volatility.
What does this tell you?
This tells you that the range of the candles on the left side chart is large:
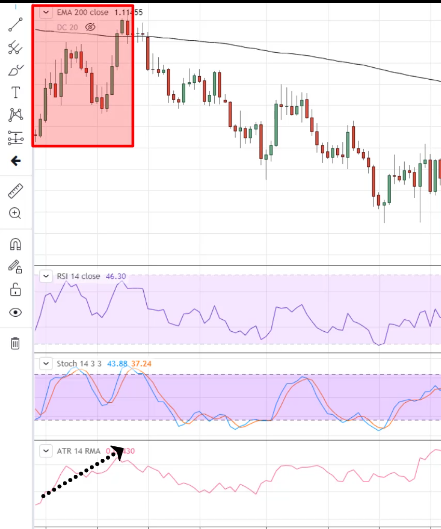
You can see that this is what ATR does. It helps you identify the market volatility whether it's high or low and then maybe you can use it for the appropriate trading strategy for these different market conditions.
2. Area of value
You might be wondering, where might potential buying or selling pressure come in?
You can use a tool like moving average or stochastic.
Let me explain.
For example:
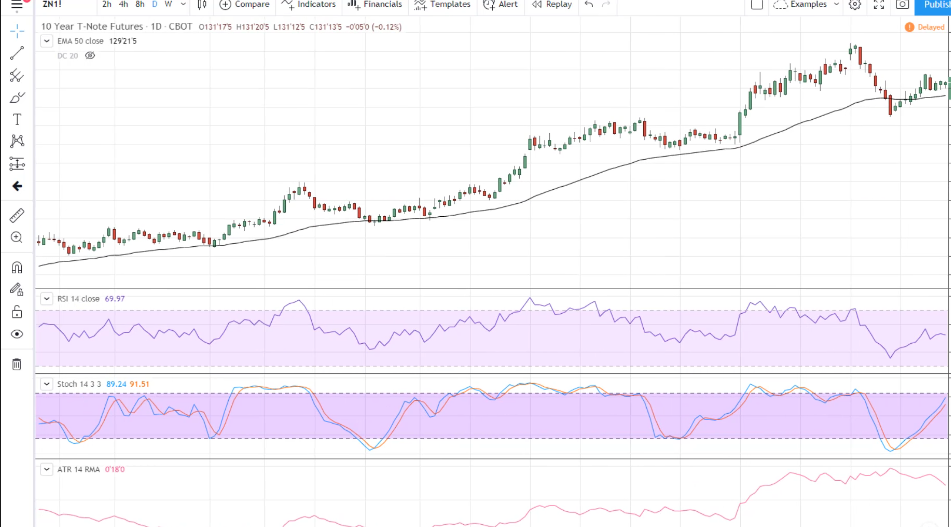
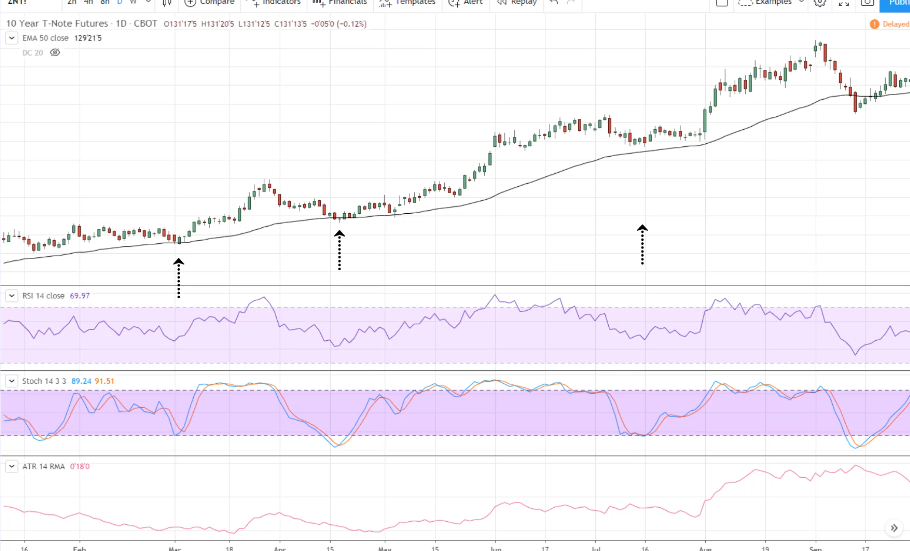
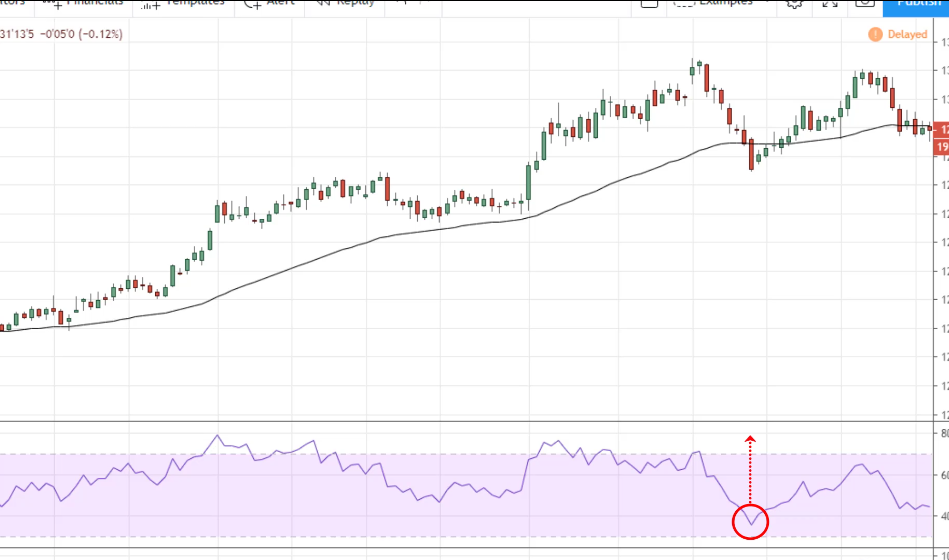
You notice how the price respects the 50-period moving average:
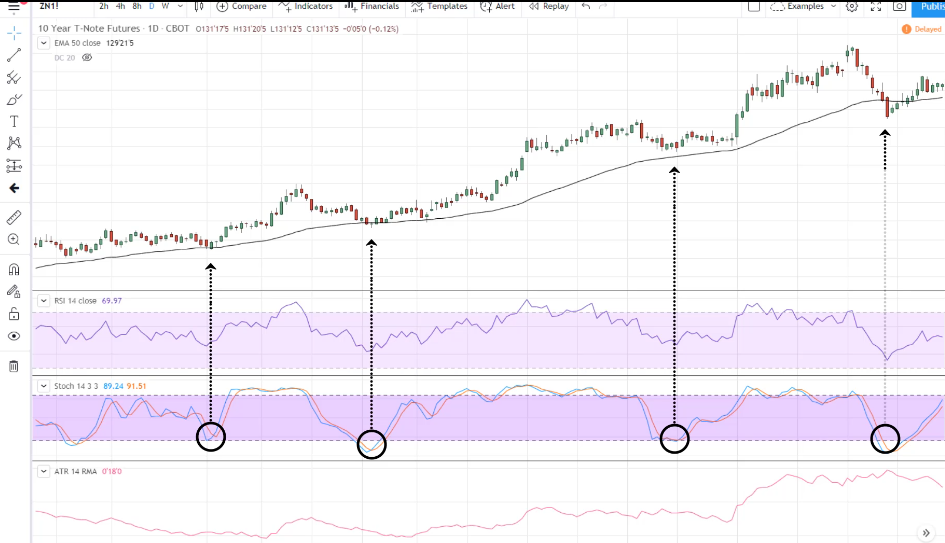
The 50 periods moving average is acting as an area of value where potential buying pressure could come in.
You can use a tool like the stochastic as well, whenever the price is below 20 could be an area of value as well.
These are two different indicators to help you identify an area of value on the chart.
In essence area of value is telling you where you should be buying or selling.
Whereas the trending market tools help to identify the market condition, it tells you what to do.
Should you be buying or selling. Therefore, area value tells you where to buy, where to sell.
3. Entry trigger
Once you have your trading setup requirements. What is your entry trigger to get you into a trade?
For many traders, these can be a simple candlestick pattern like a hammer or a shooting star.
But you can also use indicators to get you into a trade as a trigger like the relative strength index and the Donchian channel.
Here’s an example:
Using the RSI, you can look to buy when the RSI crosses above 3.0
That's one way to serve as an entry trigger. If you think about this what the RSI does is that it measures momentum in the market.
When the RSI crosses above 30, it tells you that there’s bullish momentum coming to the market and you can look to buy when it crosses above 30.
This is an objective way to enter a trade as an entry trigger.
The same for stochastic, you can use it as an entry trigger with stochastic crosses above 30.
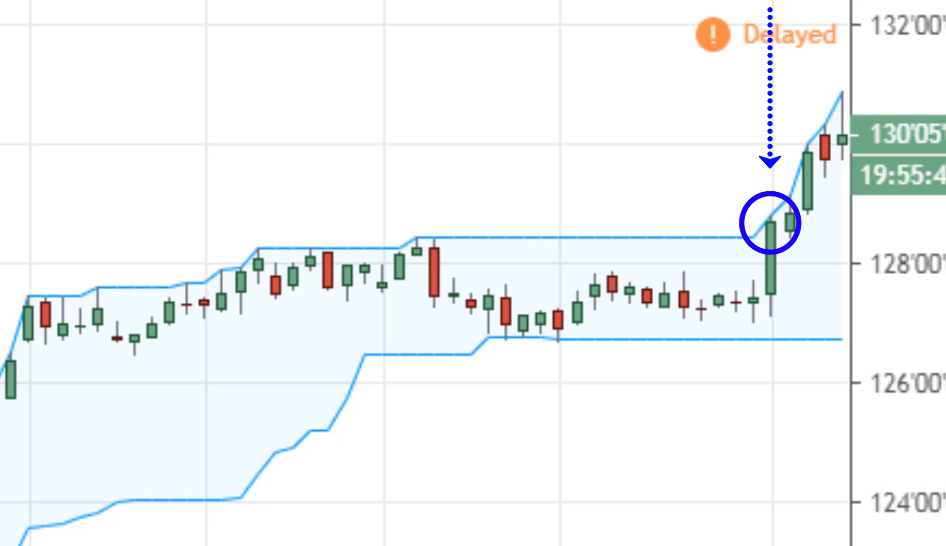
The Donchian channel, what it does is that it measures the 20-week high and 20-week low by default.
If you want to trade breakouts, you can use the Donchian channel, it will help you.
Whenever the price hits the upper blue line is telling you that it has made a 20-day high, there could be an entry trigger.
4. Trade management
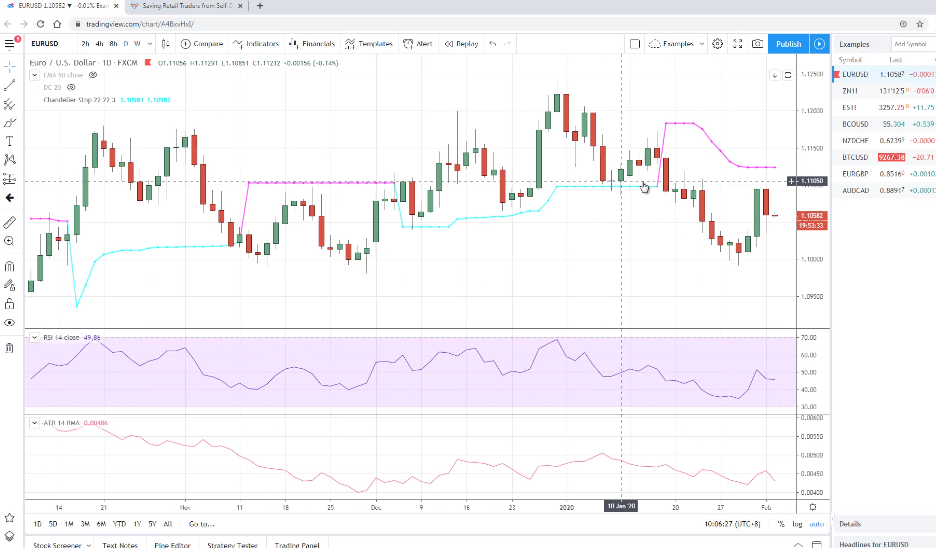
Finally, the last group of indicators to help you manage your trade, to set your stop loss, set your target profit or trail stop loss, you can use your chandelier stop, pivot points, ATR. etc.
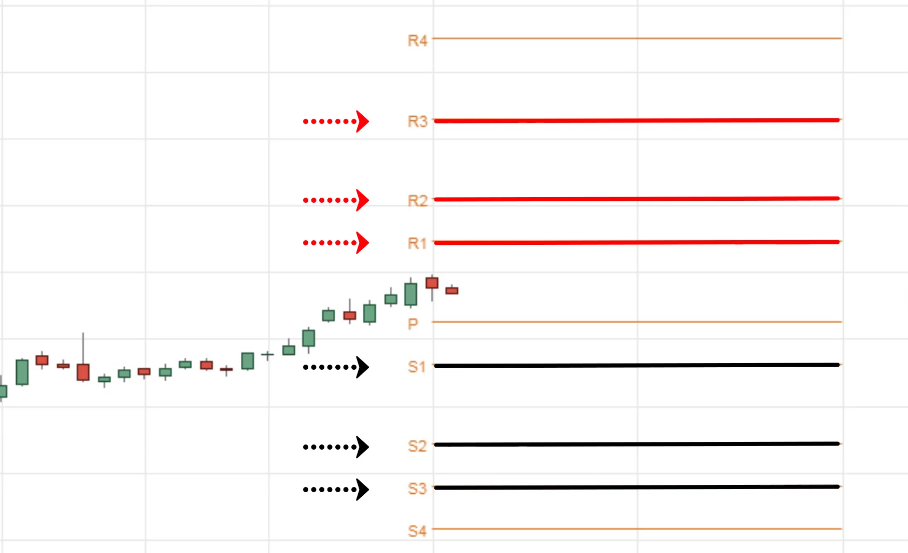
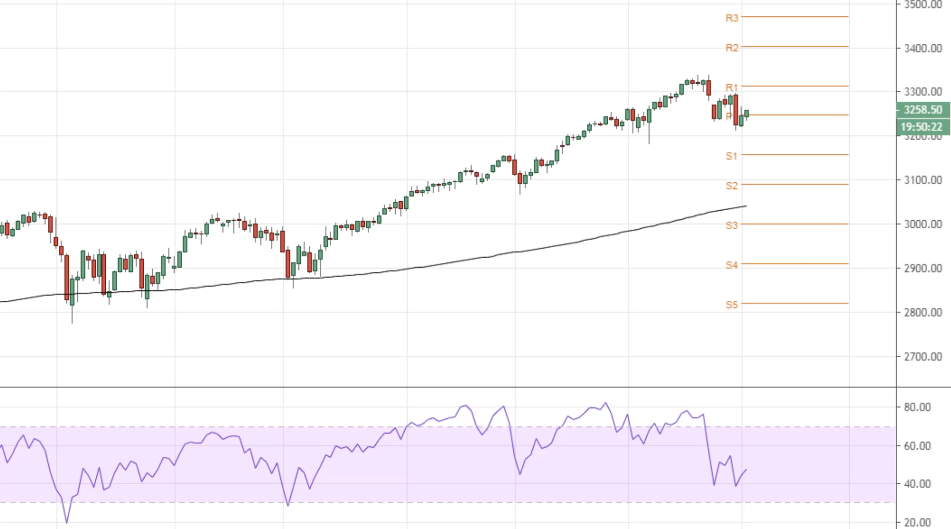
Let's say we are going with a pivot point. This is something that is used commonly. I'm just going to find out the pivot point standard.
We're going to see a bunch of lines on your chart. You can ignore all the earlier lines because it's irrelevant.
The way pivot point works is that it takes the high, low, closing price of the previous day and then plot out the support and resistance for the day.
What this tells you is that based on the previous day price, this is the current pivot for today. You might find resistance at this level and support at this level.
This is how the pivot point works. You can also use this as target profit to exit your trades.
Let me just show you what the Chandelier stop means.
What happens is that you see this blue line and this pink line. (The settings I use is 22, 20, 3.)
Earlier, we talked about the ATR which measures volatility in the market.
When you trail your stop loss, you don’t want to set your stop loss too tight because there could be just a spike due to market volatility and it gets stopped out.
One way to go about it is to use the volatility of the market to trail your stop loss. What you can do is that you can use the chandelier stop.
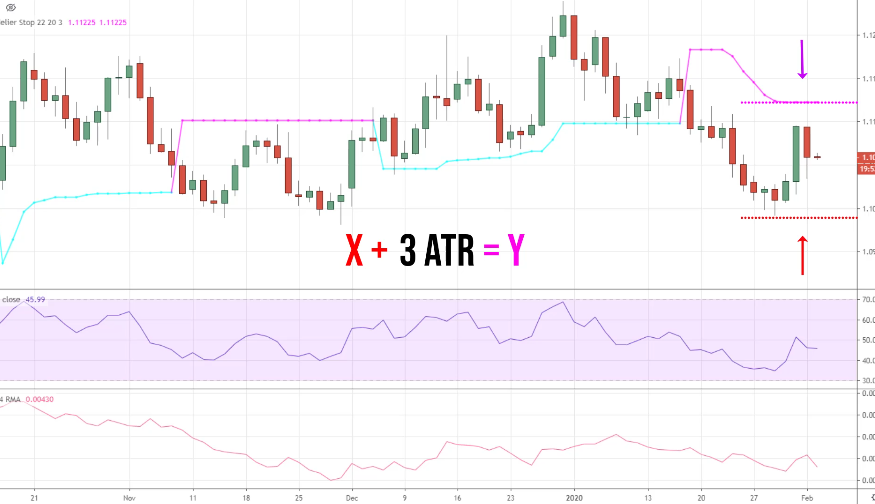
It adds a multiple to these ATR value.
For example, in the market you saw earlier, I used 3 ATR.
Let’s call the lows X. You add on 3 ATR and this value, let's say it's called Y.
From this highest to this lowest is 3ATR.
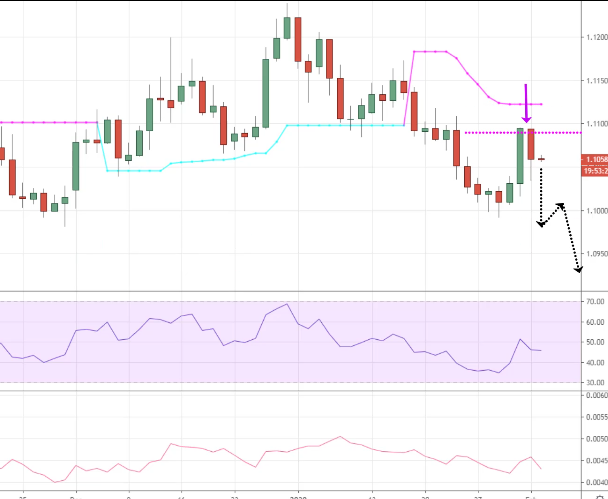
What the chandelier stops do is that it gives you a level to trail your stop loss.
You can ride trends in the market. So as the price heads lower, the pink line heads lower as well.
This is very useful to know the trends in the market. That's how this indicator work.
Best indicator combinations
What is the best indicator combinations? How do you combine indicators?
The general guideline is:
- Know the purpose
- 1 indicator from each category
- Not more than 3 indicators
I’ll explain.
Know the purpose
You have to know the purpose. What are you trying to achieve with your indicators? Are you trying to define the trend? Are you trying to use it as an entry trigger?
Are you using it to identify the area of value? What is the purpose? You must know the purpose.
1 indicator from each category
Only pick one indicator from each category early, earlier you saw the many mistakes traders make, three indicators from the same category doesn't make sense.
Not more than 3 indicators
Only pick one indicator from each category and try not to have more than three indicators on your chart.
For me, I use one or two and sometimes nothing at all. It depends.
If you are a price action trader, I would say one or two indicators are more than enough to supplement your price action trading analysis.
Example #1 (swing trade in a trending market):
If you’re looking to capture a swing in a trending market. You can use these 3 indicators:
- Moving Average
- Relative strength Indicator
- Pivot Points
Let me show you and I'll explain why.
We talked about the RSI, I like to use a 10-period RSI because it's more responsive and takes into account two weeks of data.
I like to use 20-period for the ATR.
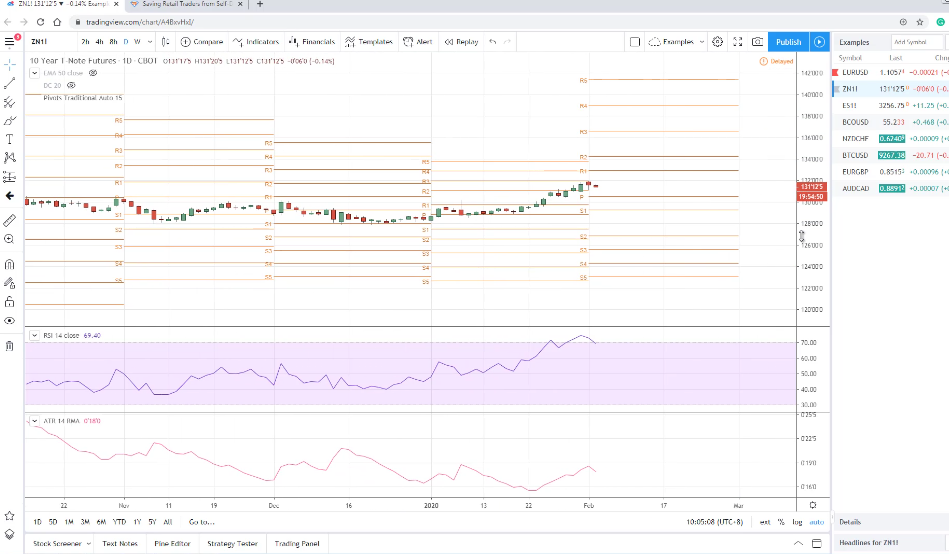
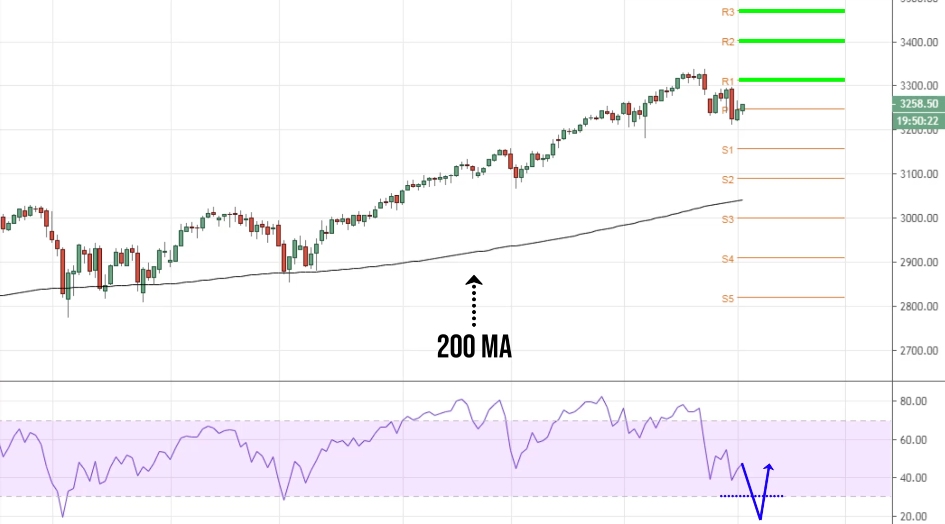
We are going to use the three indicators: Moving average, RSI, pivot points.
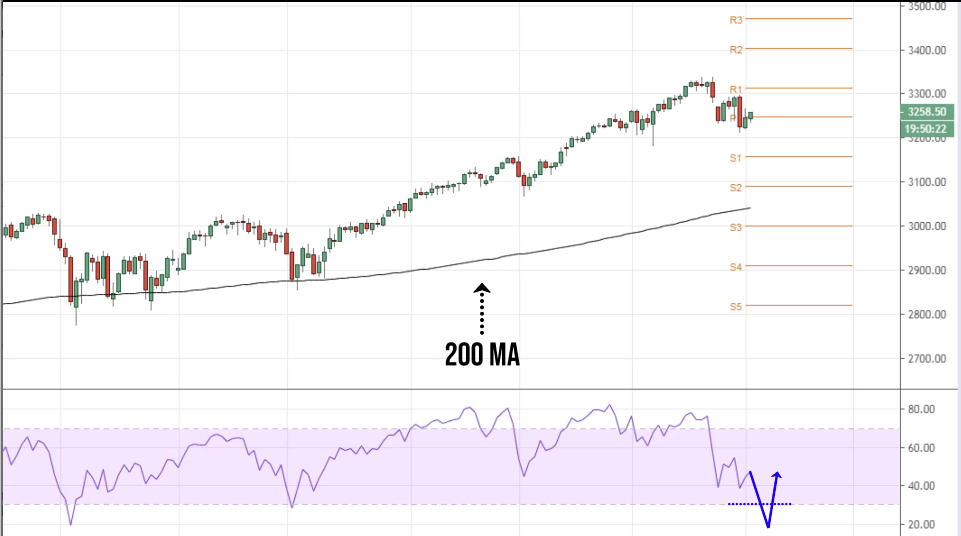
We are using this moving average to identify the trend for us since the price is above 200 EMA, we can conclude that it's an uptrend. So we're looking for buy opportunities.
Next, we are using the RSI as an entry signal to enter a trade. The entry signal could be RSI below 30.
Right now, RSI is still not below 30. If it goes below 30 and spikes up higher. We will enter long. That's helping us define the area of value and an entry trigger.
The area of value is RSI below 30. The entry trigger is RSI crossing back above 30.
We can use the pivot point to help us define where the market might find potential selling pressure and define levels to take profit. It could be R1, R2, R3.
Can you see how all these different indicators have their purpose?
Example #2 (low volatility breakout trade)
Let's say you're looking for a low volatility breakout trade.
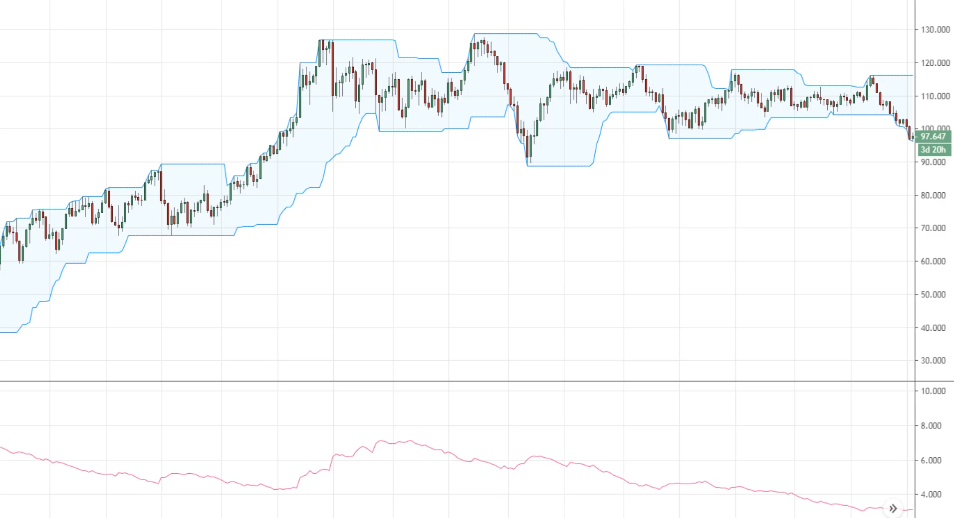
What you want to do over here is to get the ATR indicator to help you identify volatility in the market.
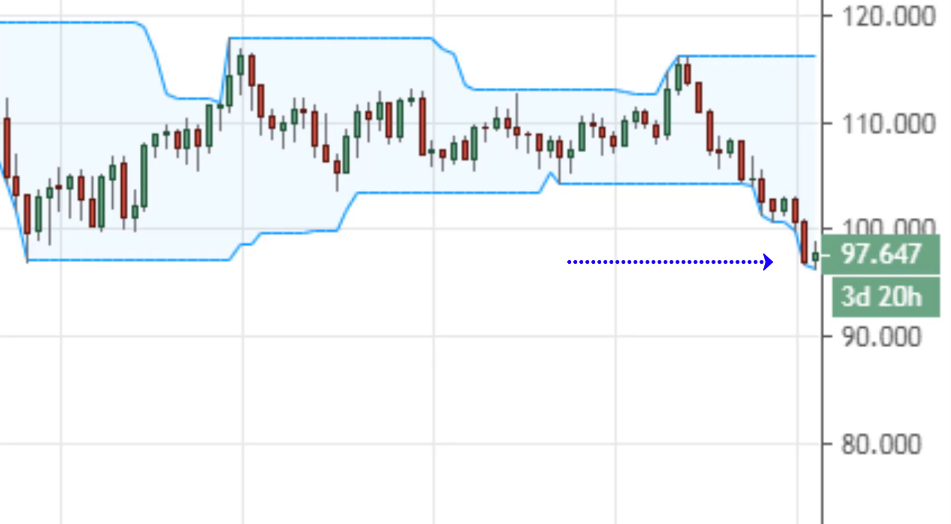
We can see that the volatility in the market is very low, near the multi-year lows.
The Donchian channel can serve as a trigger to enter the trade. As you can see over here the price breaks below this blue line, it hits the lows of the blue line. It's telling you that it has made a 20-week low.
This could be a low volatility breakout trade. The price has broken a 20-week low in a low volatility environment.
Then you can use the chandelier stops to trail your stop loss.
Or you can use a 50-period moving average and exit only with a price above it.
You can see how the moving average, the ATR and the Donchian channel, are combined to form a trading setup. I hope this makes sense.
Now let’s recap...
Recap
- Different indicators have different purposes
- Know what you need
- 1 indicator from each category
- Not more than 3 indicators

