#16: Market Structure
Lesson 16
How to trade Candlestick Patterns
In this video, we will be discussing how to trade candlestick patterns.
But before I do so I think it would make sense to kind of do a brief recap of what you have learned so far in this candlestick course:
- We talked about the introduction to candlestick, how to read it, the open, high, low, close, etc.
- The limitations of candlestick pattern. Candlestick patterns don’t tell you how the price move from point A to point B, from the open to the close.
- The various patterns of candlestick like Harami, hammer, engulfing pattern, etc.
- How not to trade candlestick patterns. You don't want to be trading them in isolation because it doesn't give you an edge in the markets.
- Candlestick patterns by itself is not a trading strategy because it does not go into stuff like the condition of your trading setup, your risk management, your exits, etc.
So, needless to say, we will be discussing…
Market structure
Market structure is simply support and resistance on your charts, swing highs, and lows.
These are levels on your chart attracts the most attention.
Because traders all over the world can see them!
And this is where they base all of their trading positions.
Like looking to enter the breakout, and looking to place their stop loss at this obvious level.
And how you can combine candlestick patterns with market structure is that you are basically looking to enter your trades after strong price rejection.
Because this is where traders do get trapped.
Let me explain:

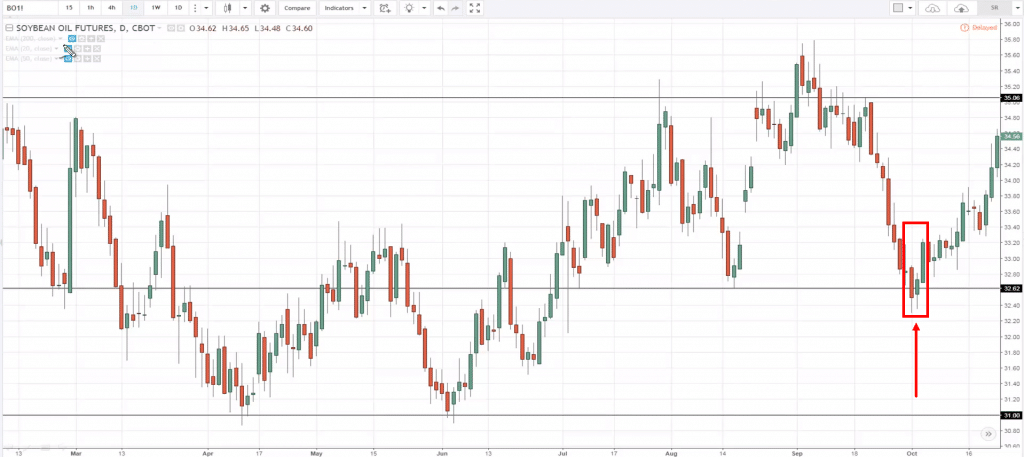
This chart is soybean oil futures.
As you can see, the market is somewhat in a range and it is contained between the area of resistance, support.
And then it had a strong price decline coming into the area of 32.62 support.
There will be traders who look at this and say, "Oh! man, look at this huge bearish momentum. I'm going short."
So, they go short…
And what happens next is that on the next candle at support, you've got a Harami.
But I would say that the bulls are somewhat in control.
Why is that?
Because price came into the area of support and it got rejected relatively quickly!
And earlier if you recall, I mentioned that traders are trapped.
Who are these traders that got trapped?
They are basically traders who went to short the breakdown!
Most traders are feeling the pinch right now.
And most traders, I suppose, they would not use a stop loss.
And what happens when the markets go against you?
Chances are you would endure until you cannot tolerate the pain anymore and you cut your losses.
When you do cut your loss what happens?
From a short position and you exit your trade, it will suddenly become a buy order.
Because you need to use a buy order to exit your short position, and this would fuel for the price buying pressure.
This is why this setup works. Because you are basically profiting from traders who are trapped when they short the breakdown.
And this is a form of price rejection.
Price comes into a level and moves away quickly from that level.
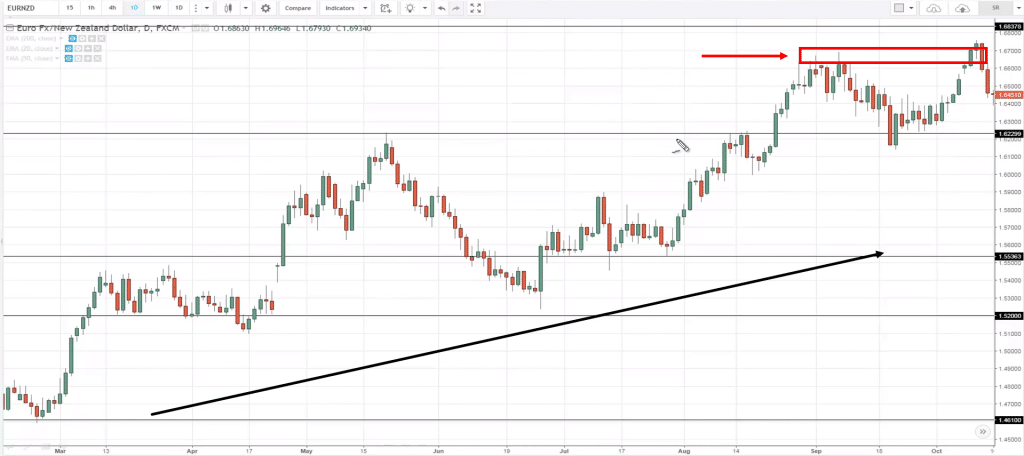
Another example is this one over here is the EUR/NZD chart:
This is somewhat a counter-trend setup.
It’s going against this longer-term trend, but the principal still pretty much holds the same.
Traders will look at this chart and when it trades beyond this high they look to long the breakout!
Because they're all "Hey! the trend is up, the price is breaking off the highs I better get long, I don't want to miss this move."
Price broke out above the previous swing high and then what happened?
The next candle... Boom!
You've got a bearish engulfing pattern.
Again, who is trapped right now?
Well, traders who are long are clearly trapped, because they expect the price to move higher and now price is turning against them.
And once again, eventually when they do cut their losses it would fuel further price decline.
But one thing to mention here is that if you look at a big picture...
You have to understand that overall, this long-term trend is still intact.
So, if you were to short this market, don't expect a massive price reversal where the market collapse all the way.
No, no, no, don’t think along that lines because more often than not that's not going to happen.
Instead, If you are going against the trend and just looking to capture one swing.
I would say that you only take just one swing.
Do not expect the entire move to reverse.
Because as I've said, candlestick patterns do not give you the direction of the trend.
This is a clear example of why candlestick patterns is not a strategy in and itself.
You still have to look at market structure, targets, and trade management, and stuff like that.
But what I'm trying to highlight to you here is that candlestick pattern can provide as an entry trigger, combined with market structure into when to enter your trade.
Okay?
So, with that said, let’s do a quick recap...
Recap
- Candlestick patterns combined with the market structure like support resistance, swing highs and lows, can give you entry points and entry triggers.
- And you want to enter your trades after strong price rejection because this is where traders get trapped.
I hope this gives you a good idea into how you can go about trading candlestick patterns

