#10: How to Identify and Follow the Trend
Lesson 10
I'm sure you’ve heard of the saying, “the trend is your friend.”
But it’s not quite simple saying that the trend is your friend.
Maybe you look at the daily timeframe, the market is in an uptrend.
But when you go down to the 5-minute timeframe, the market is in a downtrend!
Should you be buying?
Or should you be selling?
That’s the first issue.
Another thing is that maybe you think the market is in an uptrend, and then it was followed by a strong reversal candle to the downside collapsing lower.
You go short thinking that the uptrend is over.
Before you know…
The market reverses again and the uptrend continues and you get stopped out of your trade.
I would say that these are the few common problems traders face.
That's what we'll tackle in today's lesson on how to actually identify and follow the trend.
Sounds good?
Then let's get started.
How to Identify and Follow the Trend (My Secret Technique)
There are a few things that I uncover:
- Trend is relative
- Market structure
- Swing points and last line of defense
Let me explain…
Trend is relative
Here's the thing…
There's really no such thing as a “trend.”
This isn't some matrix or inception trying to confuse the heck out of you, but really…
The trend is relative.
It all depends on the timeframe you're looking at.
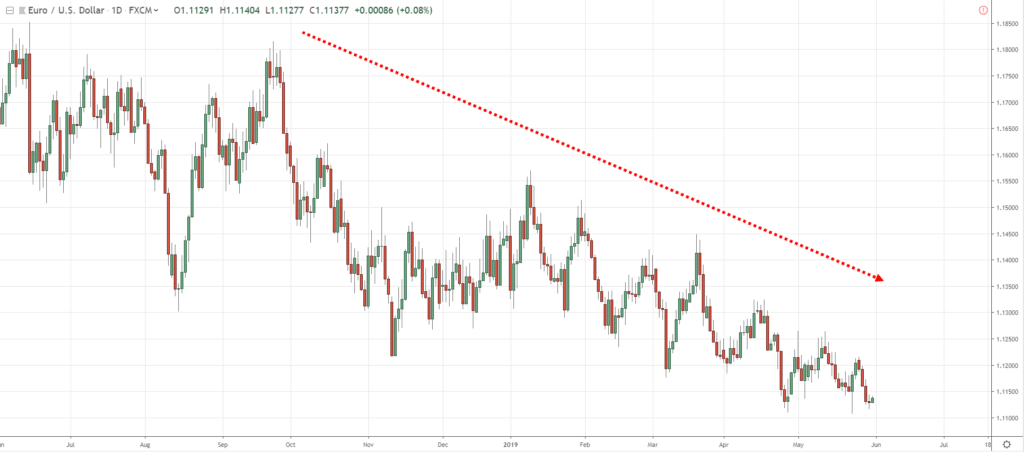
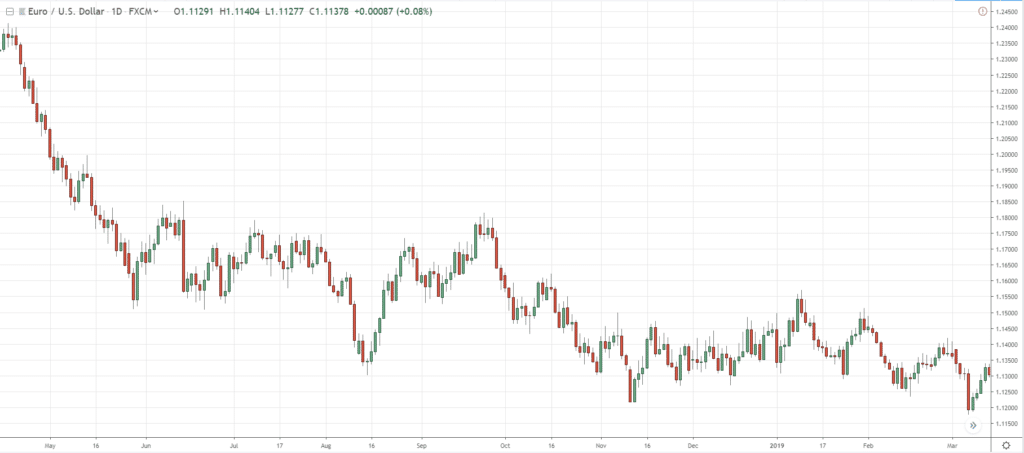
For example, you can see that EUR/USD is in a downtrend on the daily timeframe…
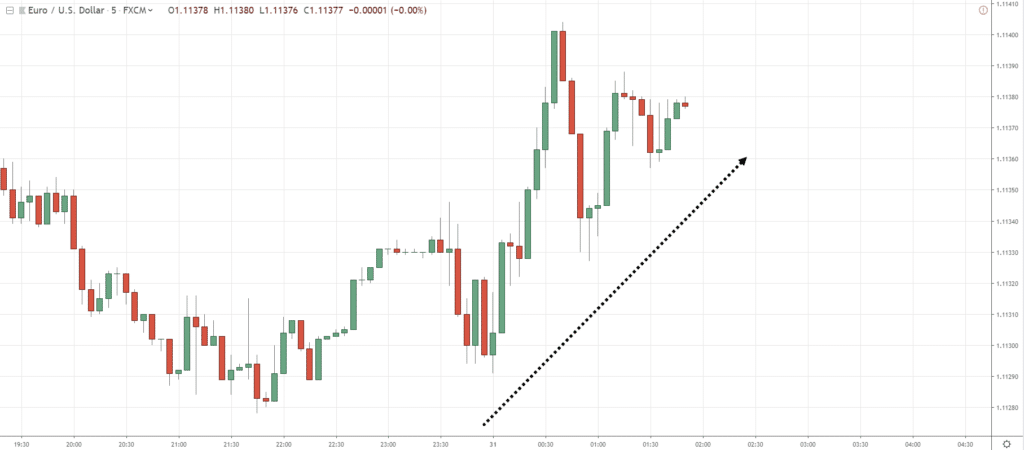
But the 5-minute timeframe in EUR/USD is in an uptrend…
You may think that there is a discrepancy but there really isn’t any.
Because it all boils down to the timeframe that you are looking at!
So the first lesson that I want to put up to you is whenever you want to define or follow the trend…
You must first define the timeframe that you want to trade on.
If you are entering trades off the daily timeframe, then identify the trend on the daily timeframe and ignore the trends on other timeframes.
If you're a short-term trader and trade off the 5-minute timeframe, then pay attention to the trends on the 5-minute timeframe.
Pay attention to the timeframe that’s relevant to you.
Second thing…
Market structure
Before we talk about how to actually identify trends…
You must understand that the market moves in cycles just like spring, autumn, summer, and winter.
And just like in trading, there are four stages of the market:
- Accumulation
- Advancing
- Distribution
- Declining
Let me explain to you the four stages of the market…
Accumulation
The accumulation stage is where the market is in a range.
And if the price breaks out of the accumulation stage, this is where we move to the advancing stage.
Advancing
This is otherwise known as an uptrend.
And as you know…
A trend doesn't last forever.
Eventually, the buyers will get exhausted and the sellers will come in.
Distribution
What happens is that the market goes into an equilibrium.
Eventually, the sellers will take control.
The price will break down and we’ll move on into a downtrend, otherwise known as a declining stage.
Declining
The market doesn't go down forever as well.
Eventually, buyers would come in and start buying, then, we move on to what we call the accumulation stage again.
Here’s an illustration that summarizes the 4 stages of the market…
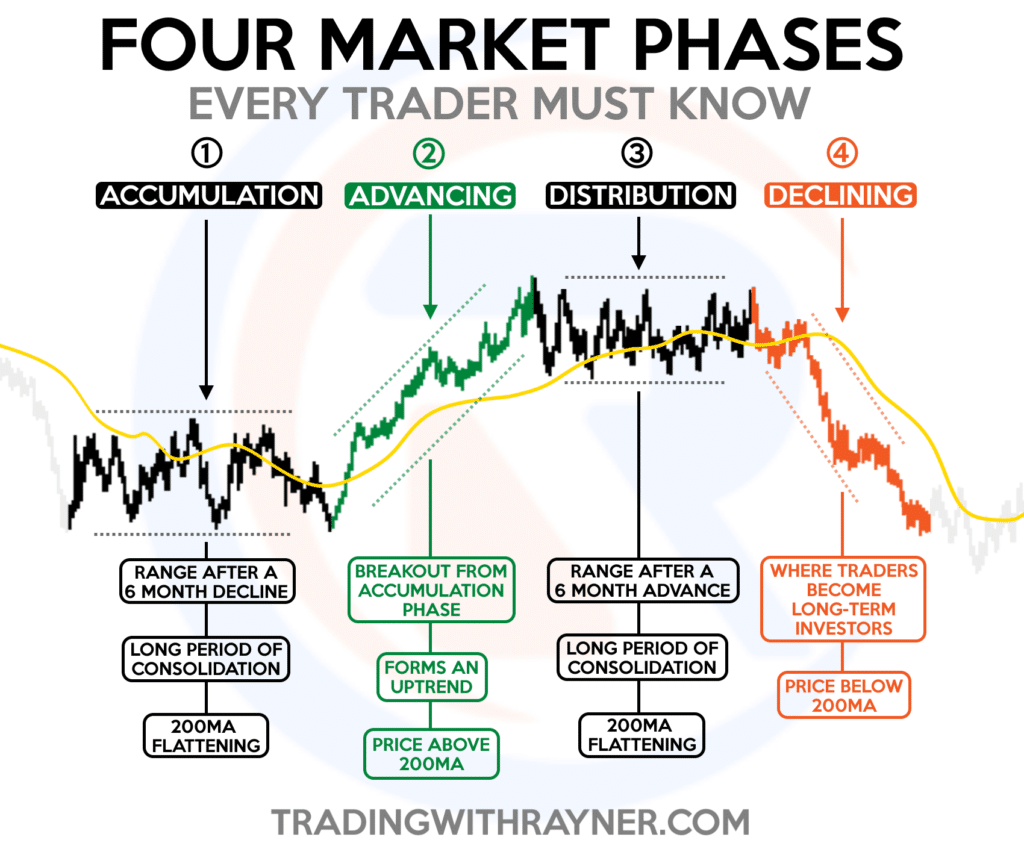
Now you might be thinking, “Why are you sharing this with me?”
The reason why I share this with you is that if you can identify a potential accumulation stage and price breaks above the highs…
This could possibly be the start of a new uptrend, and you want to be buying!
Likewise, if you notice that the market forms a distribution stage and price breaks below the area of support…
This could potentially be the start of a new downtrend and you want to be selling!
Don’t worry…
I’ll share with you a few examples later, but this is the market structure that you have to be aware of.
The markets don’t just move randomly, it has an ebb and flow to it.
The price doesn’t move 100% all the time in that manner, but generally, you can apply this framework to whichever markets that you're trading.
Moving on…
Swing points and last line of defense
Now, we are talking about how to actually identify trends.
When I identify trends, it's very important to pay attention to the swing points.
What do I mean by swing points?
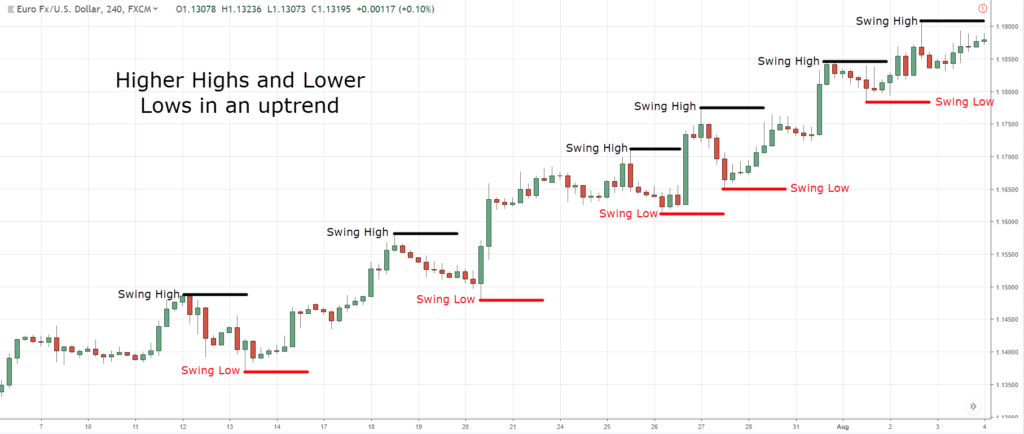
You know that a trend doesn't just go in one straight line.
It moves up like this…
Now, what I'm referring to are these levels of swing highs and lows.
Swing points are important as they serve as a frame of reference to what the stage of the market is in.
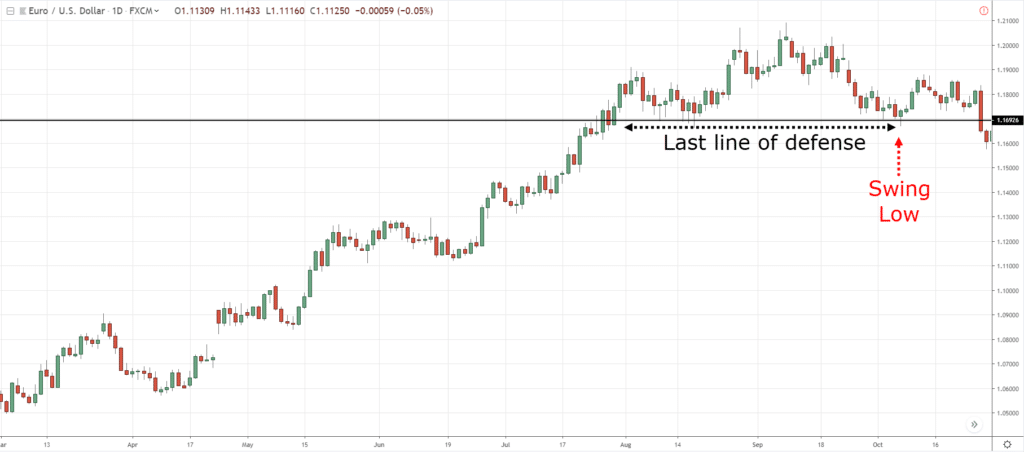
Let’s say the market is in an uptrend and then forms a swing low…
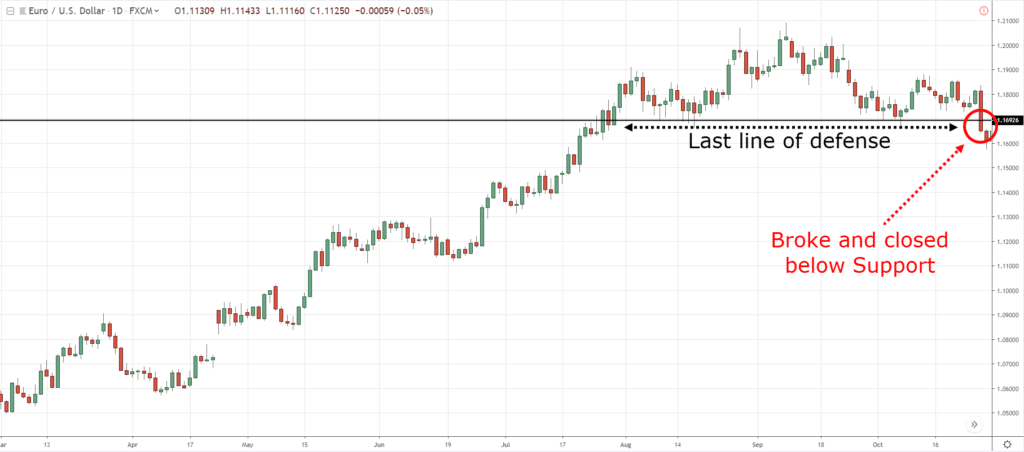
This is what I call the last line of defense.
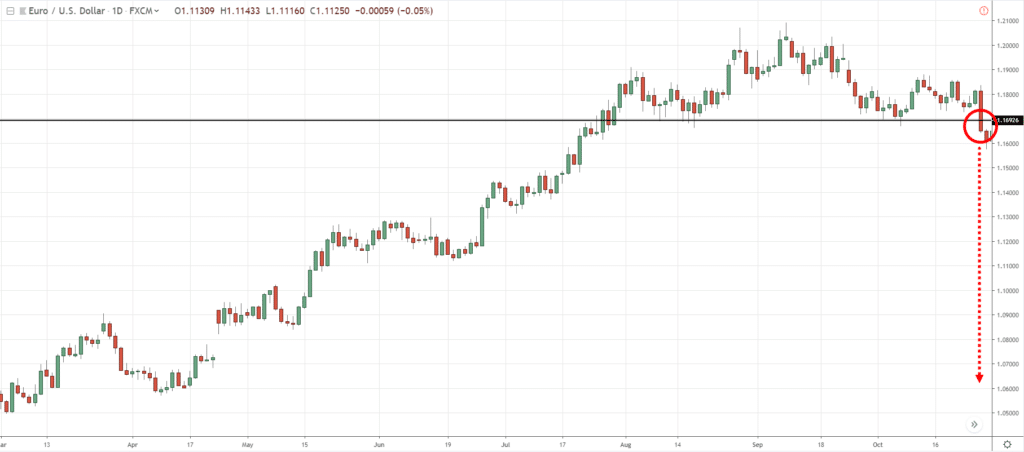
Because if prices were to break and close below this “so-called” area of support…
We can conclude that this market might potentially move into a declining stage (downtrend)…
This is what I call the last line of defense.
Because if prices were to break and close below this “so-called” area of support…
We can conclude that this market might potentially move into a declining stage (downtrend)…
This is a point in time of your chart where the price would change or confirm the dynamic of the trend in the market.
Let me walk you through a few examples to what you've just learned so far…
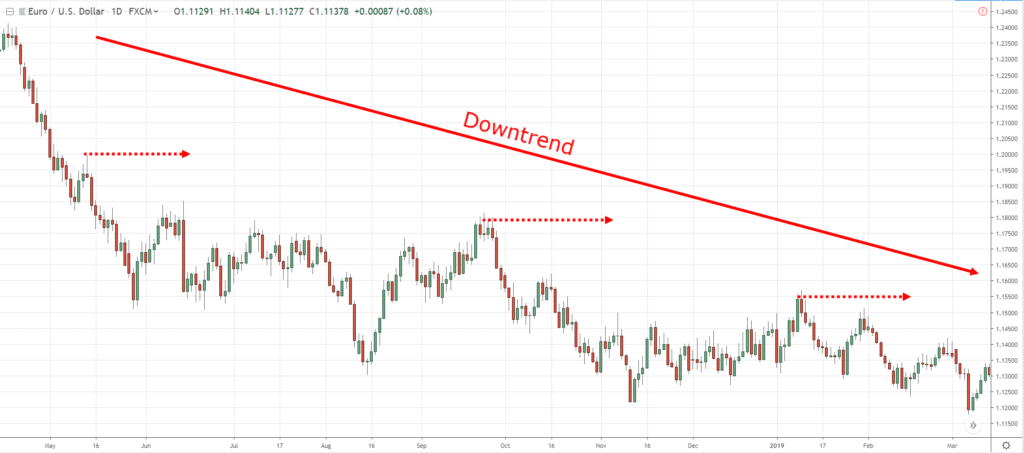
In EUR/USD Daily timeframe, I would take it as my trading time frame and I only want to identify the trend on this time frame…
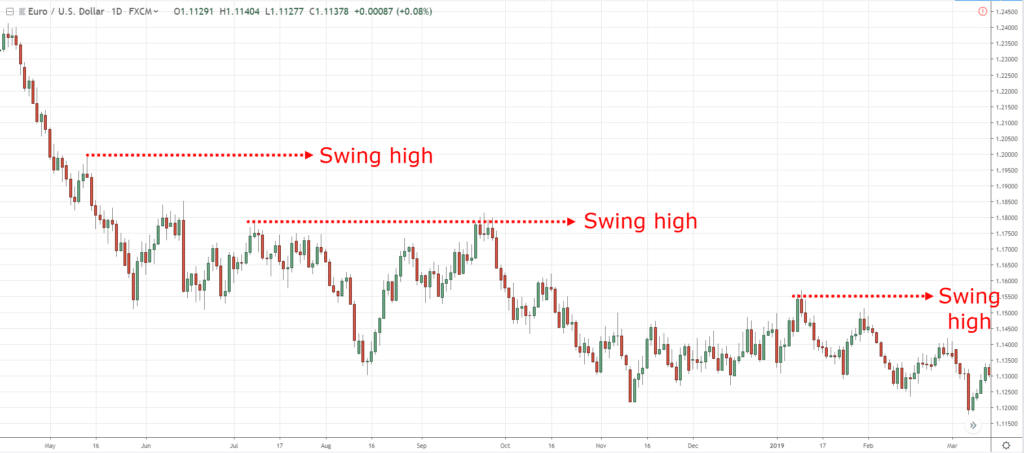
So, where are the obvious swing points?
Over here…
How do I define those swing points?
It’s the levels that stick out the most obvious in your face, those are the swing points you want to refer to.
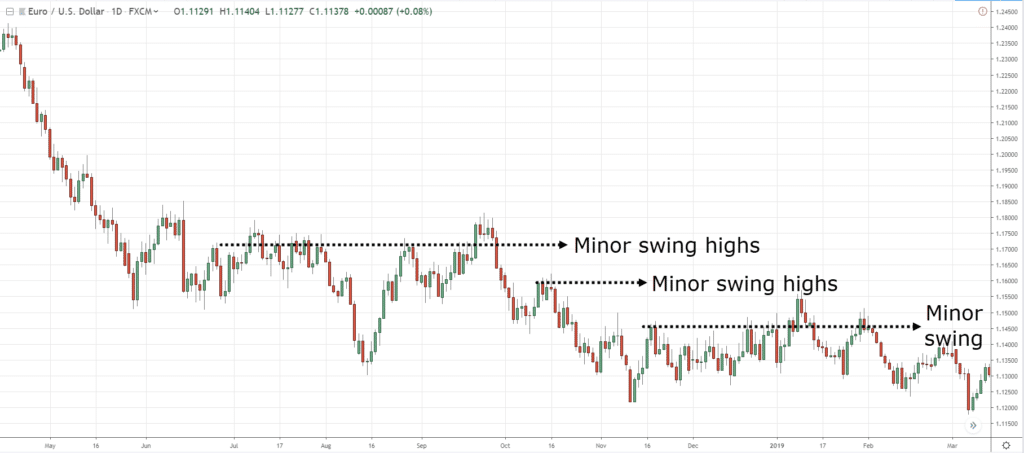
As you can see, there are minor swing points on the chart…
But these are swing points that you don't you want to pay attention to because they are not major swing points.
This needs a little bit of practice, but whenever you glance at a chart always pick the swing points where your eyes can quickly identify.
So now…
What is the trend?
You can see that the swing points are pointing in one direction, making lower highs…
If you are a trader trading the daily timeframe and you see this chart, you want to be looking for selling opportunities.
Let me ask you…
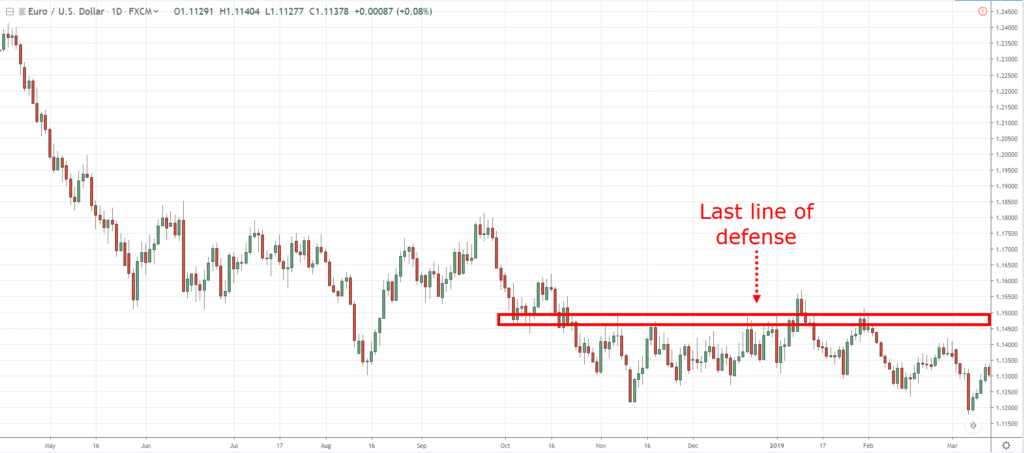
At what point is the last line of defense on EUR/USD?
If you ask me, this is the last line of defense (resistance) over here…
So, if the price comes up and breaks out of it, this is where I would shift my bias from being a seller to a buyer.
Because again, you've seen earlier the 4 stages of the market.
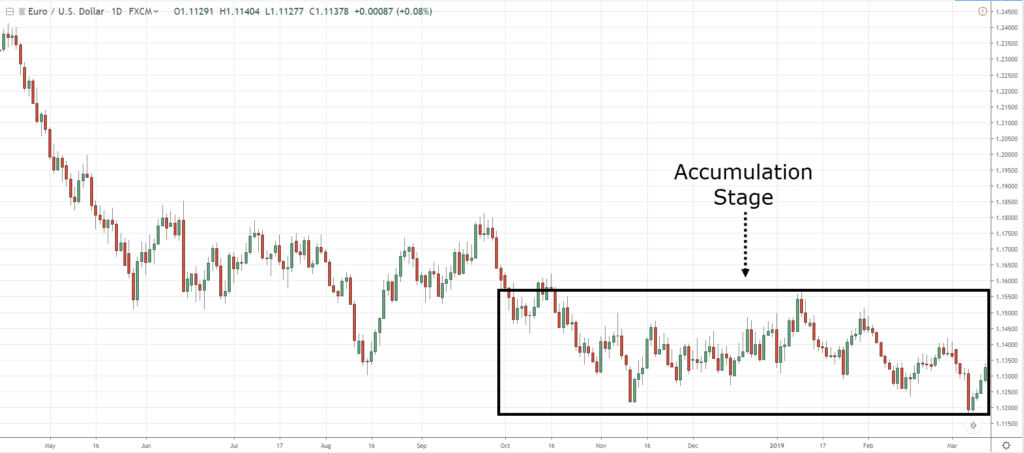
After a downtrend or a declining stage, the market could move into a potential accumulation stage.
And EUR/USD looks like a potential accumulation stage…
This is how you use the concepts that I’ve just shared with you earlier!
Identify the major swing points and the last line of defense.
And on top of it…
You're aware of the 4 stages of the market (market structure).
Now…
One thing I want to point out is that whenever you do your analysis, you want to have the same number of bars on your chart.
If not, your analysis will go haywire.
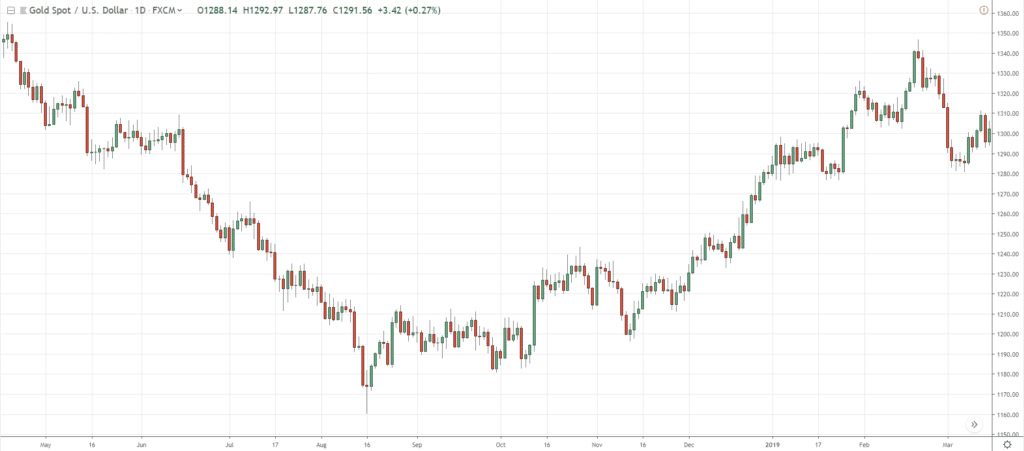
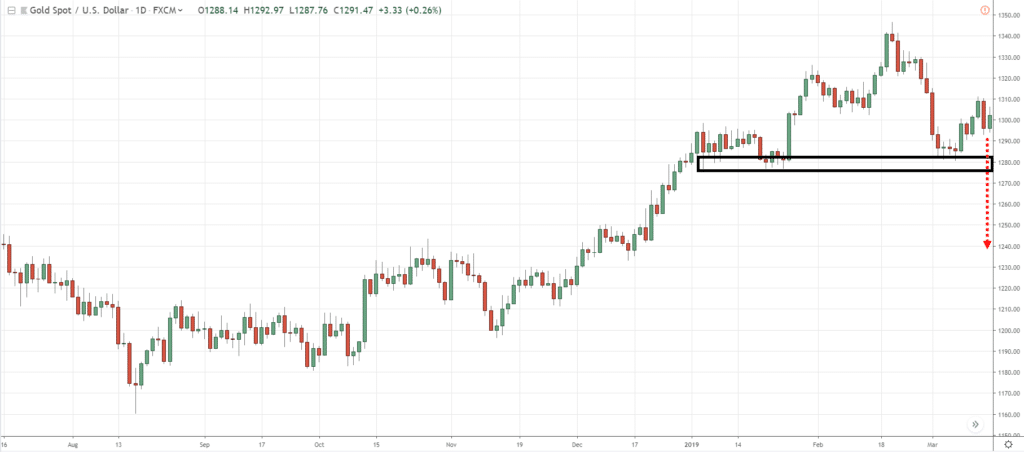
For example, this is the chart of XAUUSD…
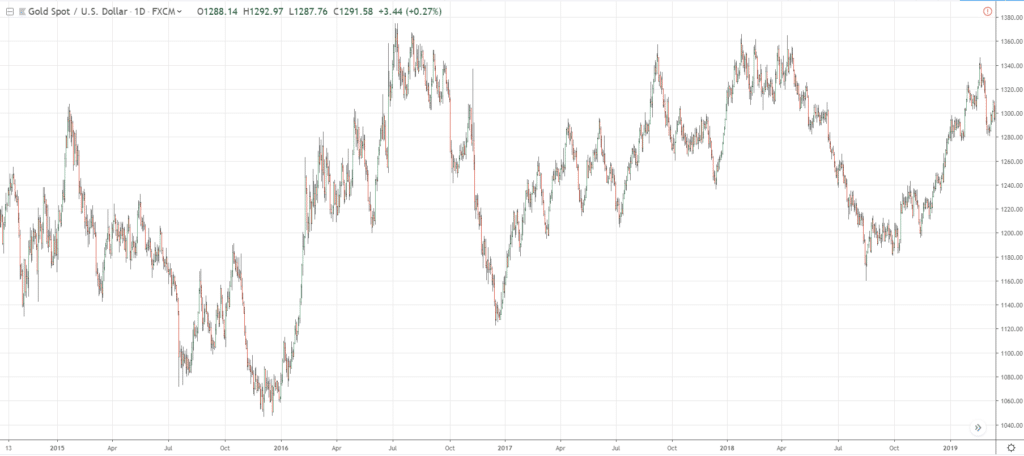
But if I zoom out my chart…
The whole analysis will change!
Because the landscape of the market that you're looking at has increased.
And your swing point or your last line of defense will change as well.
So my suggestion is stick to one time frame and to stick to the same number of candles that you're looking at on your chart.
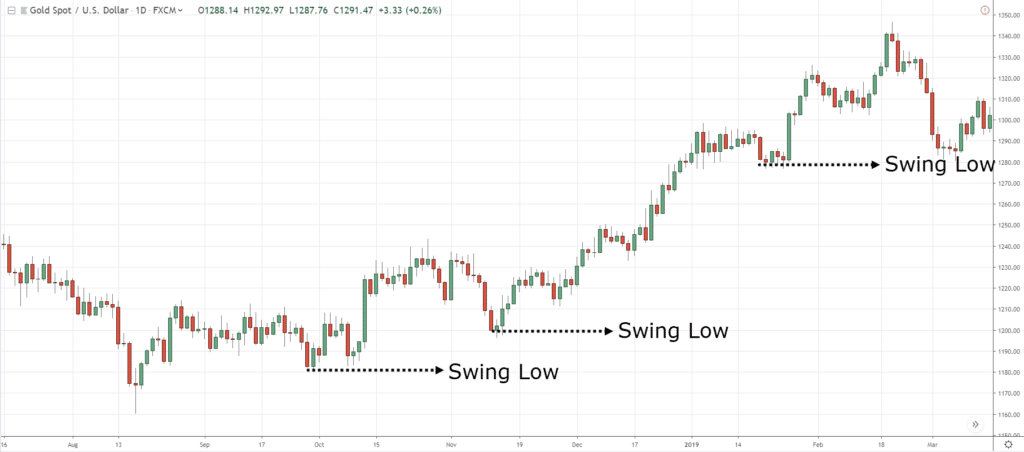
Now, in XAU/USD, where are the major swing points?
It’s over here…
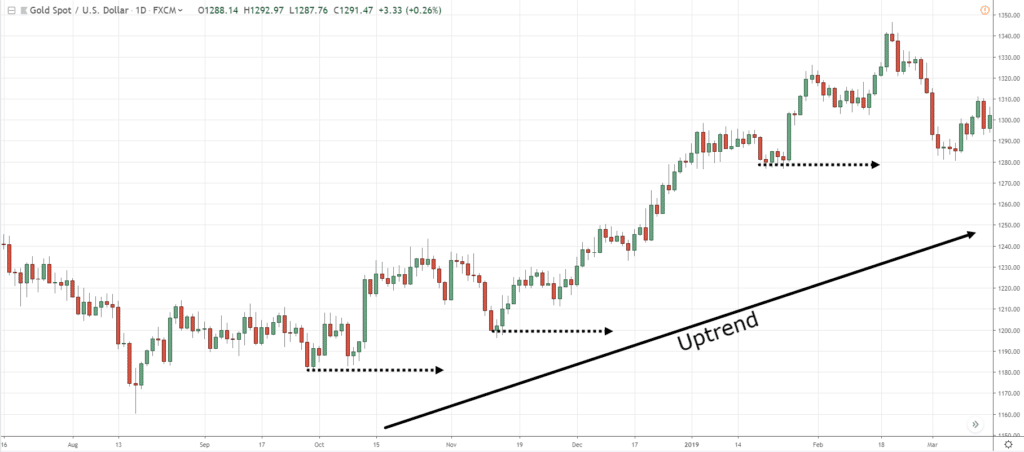
You can see that major swing points are all pointing in the same direction…
It's in an uptrend.
So if you want to follow the trend, look to buy.
But now the question is…
Where is the last line of defense?
If you ask me this last line of defense.
If the market were to break below the area of support…
I would say that the market is in a distribution stage and the market is now moving onto a declining stage, a downtrend.
I want to be looking for selling opportunities.
But if that doesn't happen, my bias is still to be a buyer in this existing uptrend.
Can you see how all this makes sense right now?
We look for major swing points.
We look at the last line of defense.
And we understand the four stages of the market.
Now, let's look at an example right that's a little bit more subjective.
Because when you are trading, the market is never as easy as 1 2 3.
Sometimes the market could be in a transition and the charts look messy and you are pretty much unsure what you should do.
So I'm going to share with you my thought process to what I would usually do.
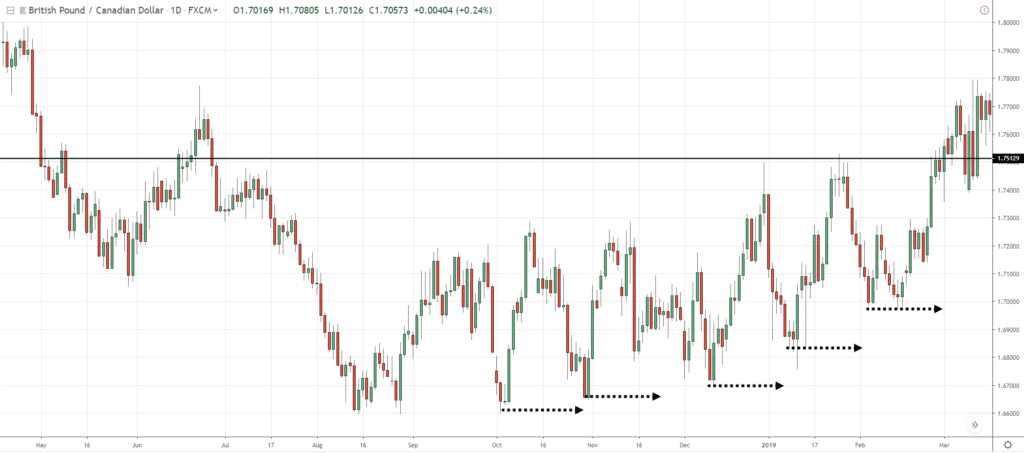
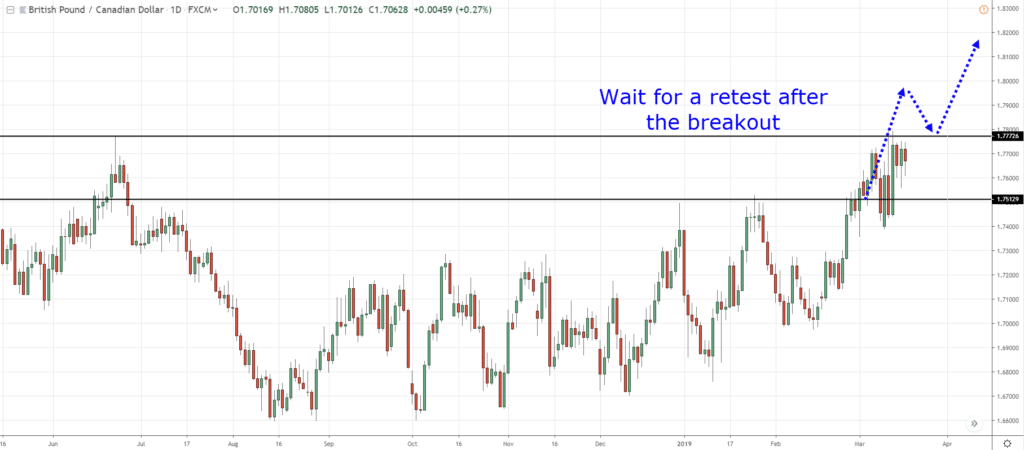
An example is the GBP/CAD which is generally an uptrend that shows major swing lows…
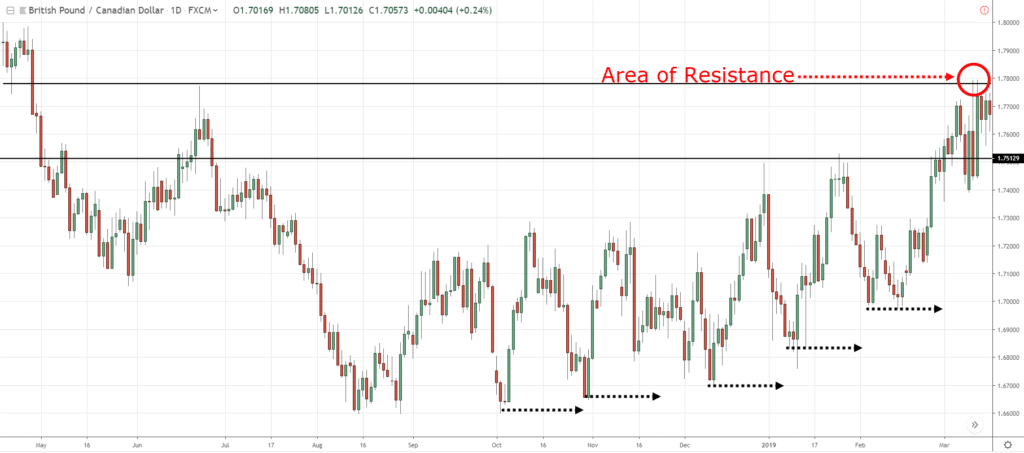
However, the price is at this area of resistance…
Yes, the market is in an uptrend.
But you don't necessarily want to be a buyer at this point in time because there is an area of resistance coming up straight ahead.
So, how would I deal with this?
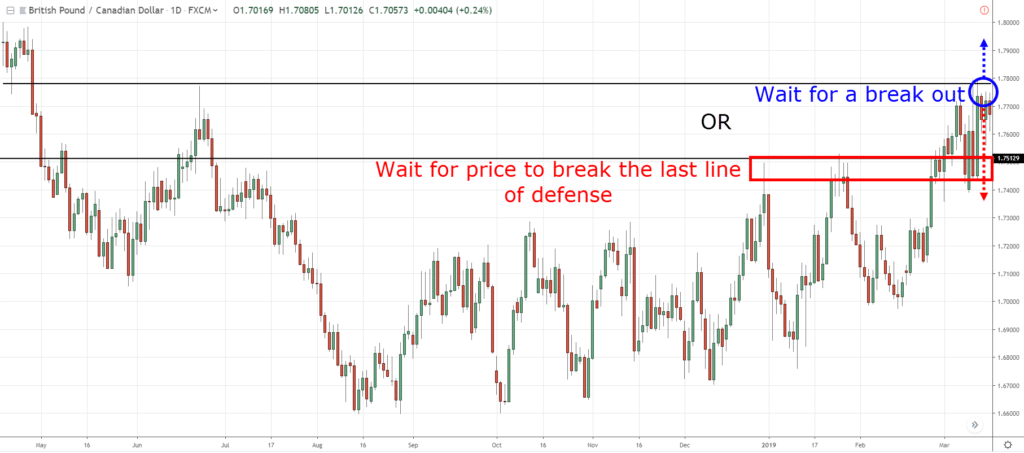
What I usually like to do is to let the price break the market structure before I make a decision!
If I would go long, I would prefer to either buy at this area over here…
Or let the price break out first, do a retest, and look for trading opportunities…
This way, I don't have any “obstacles” in my way, because the obstacle is already destroyed.
You can see that the price action may not be very clean like this example.
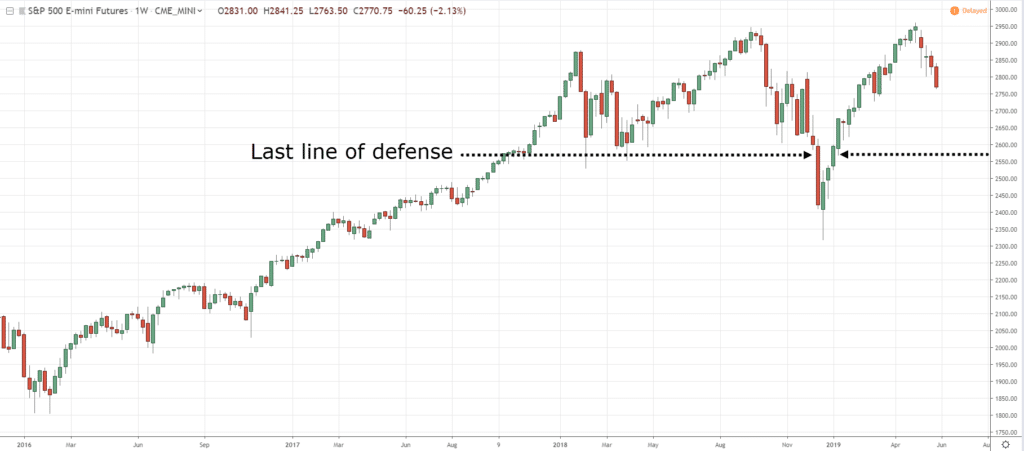
The last example is the S&P 500 weekly timeframe, which shows its last line of defense…
The price did break and close below it, but before I know it…
It made a very strong reversal back towards the upside.
So you can see that this framework is not foolproof.
The market makes a false break out regularly and you have to be prepared for it.
But it does not mean that this is a concept you can’t use.
Because if the market does a false break out and went back towards the area of support…
Your bias can be shifted towards the upside again.
After all, you realize that it is a false breakdown and the trend is still intact.
I hope you can see how this last line of defense can help you switch between knowing when to buy and knowing when to sell.
One more thing is that if the charts don't make sense to you no matter how you analyze…
My suggestion is to stay out of the markets.
There's no point forcing yourself to put on a trade in a market that you don't understand.
With that said…
Here’s a quick summary with what you’ve learned today…
Summary
- The trend is relative, it depends on the timeframe you are looking at
- Identify the market structure, whether the market is in distribution, accumulation, declining, or advancing stage
- Identify the obvious swing points and the last line of defense
- If the price breaks the last line of defense, then it's likely to move onto the next stage of the market.

