#9: Trendline Trading Strategy
Lesson 9
Hey, Hey, what's up my friend?
In today's training I want to share with you a trend line trading strategy that you can use to profit in bull and bear markets, So here's the breakdown for today's training.
Trendline Trading Strategy
- The secret to drawing Trendlines that nobody tells you
- The Trendline Bounce
- The Trendline Break
- How to use confluence and identify higher probability trading setups
I'll share with you the secret to drawing trendlines that nobody tells you. It's a simple three-step technique, and I'll share it with you.
And we'll talk about the trendline bounce strategy, the trendline break strategy. And finally, we'll talk about how to higher probability trading setups with trend lines.
That’s what we would do today.
How to draw Trendlines
- Zoom out
- Right to left
- Connect the most number of touches (body & wick)
How do you draw trendlines?
First thing is that you want to zoom out your charts or you want to see the big picture in the grand scheme of things.
Secondly, for me, I find that drawing your trend lines from right to left. It's kind of easier comparing to join from left to right.
So there is no right or wrong to this, but just that I found it if you draw from right to left, it's easier for me and I'll explain why later.
And once you've done it right, you want to connect the most number of touches that includes both the body and the wicks
It doesn't matter whether it’s touching the body or the wick, as long as you can get the most number of touches just do it right.
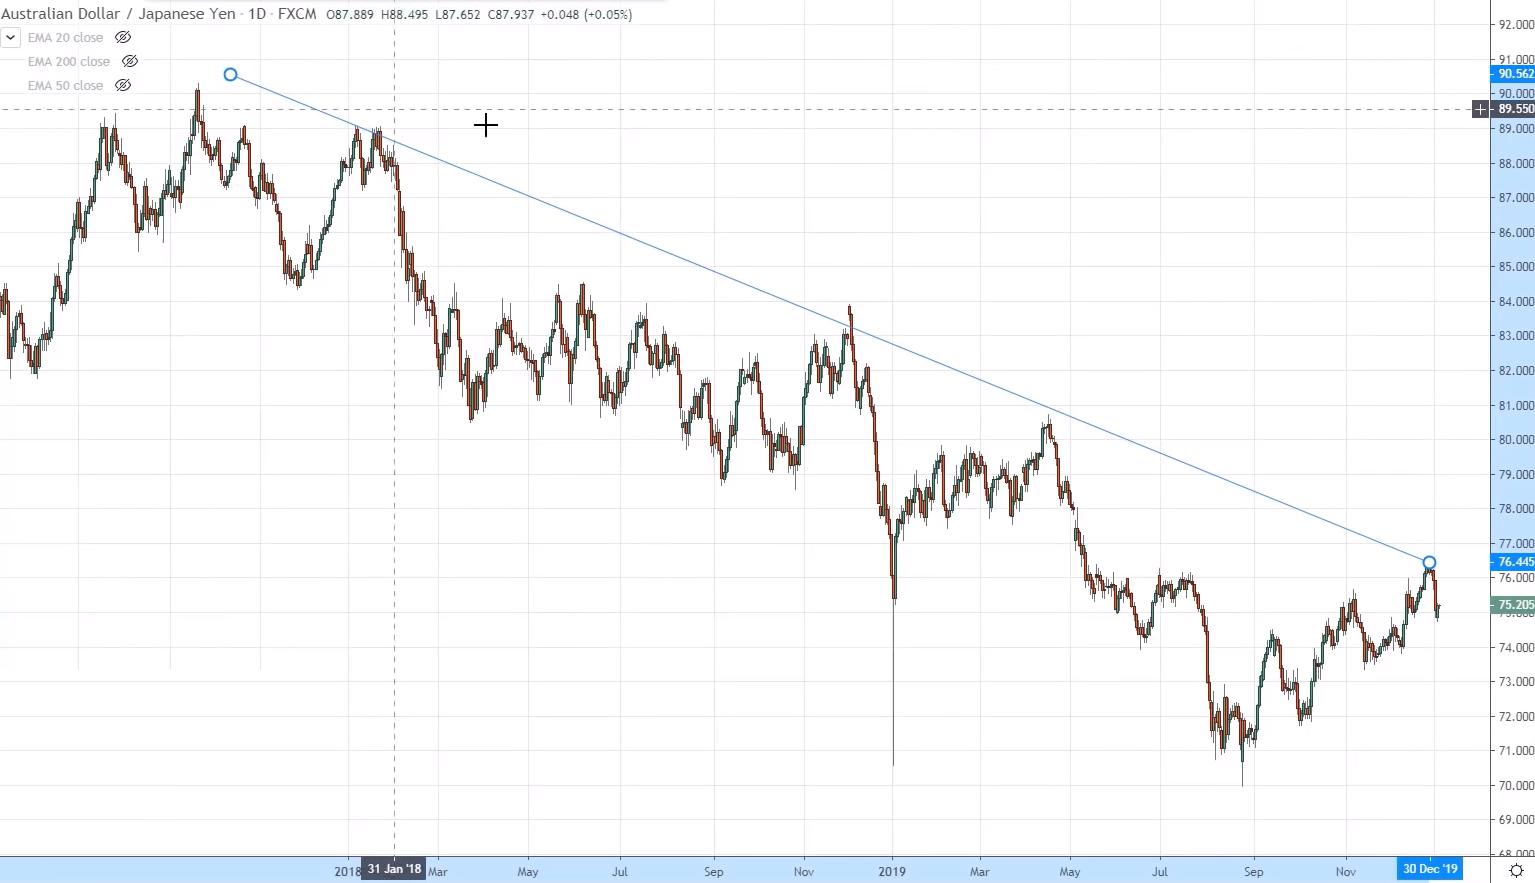
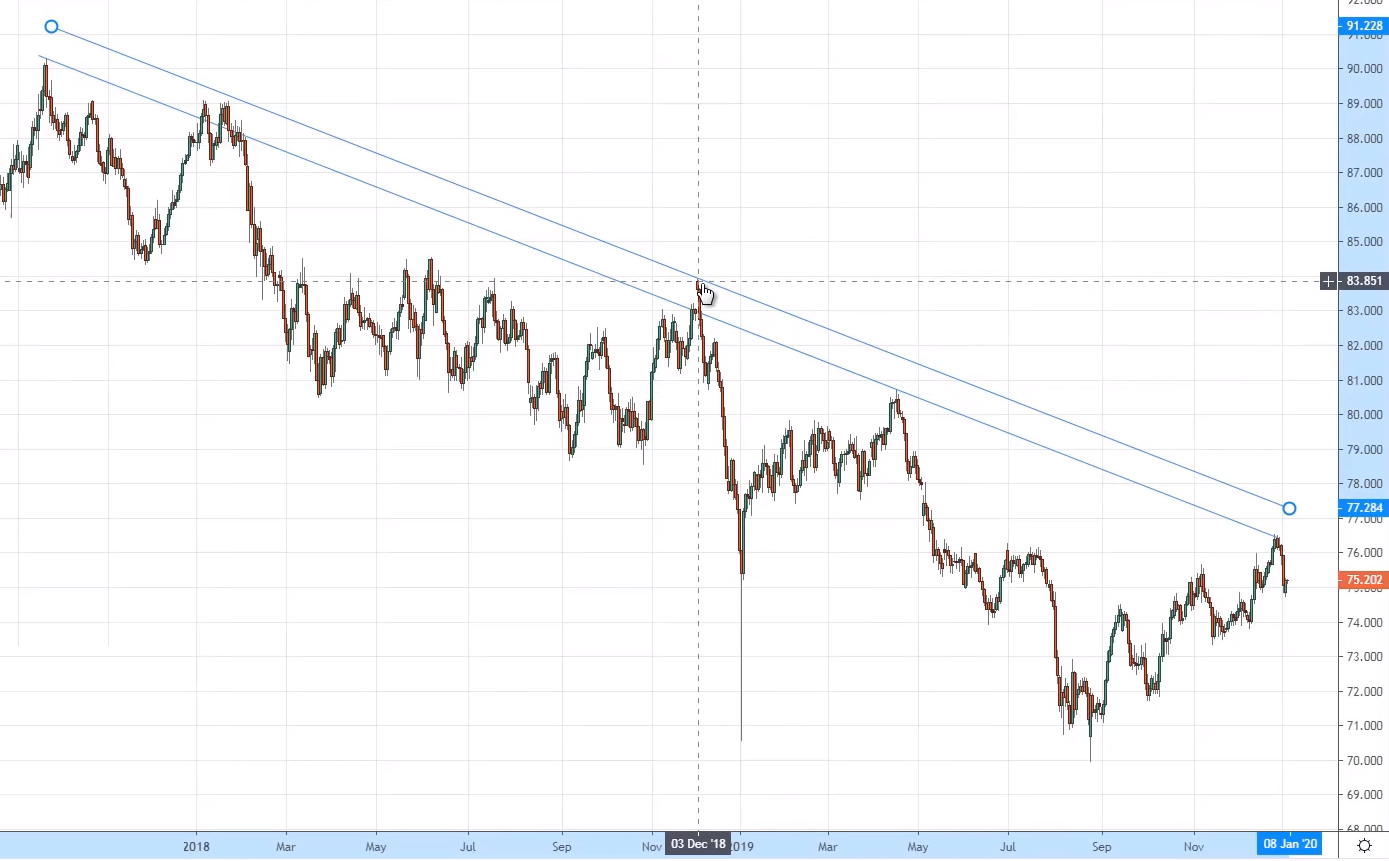
Let me explain. So this is over here AUDJPY
Remember, the first thing we talk about zooming up, seeing the big picture.
So general guideline, you can zoom out 10 times to kind of see the big picture.
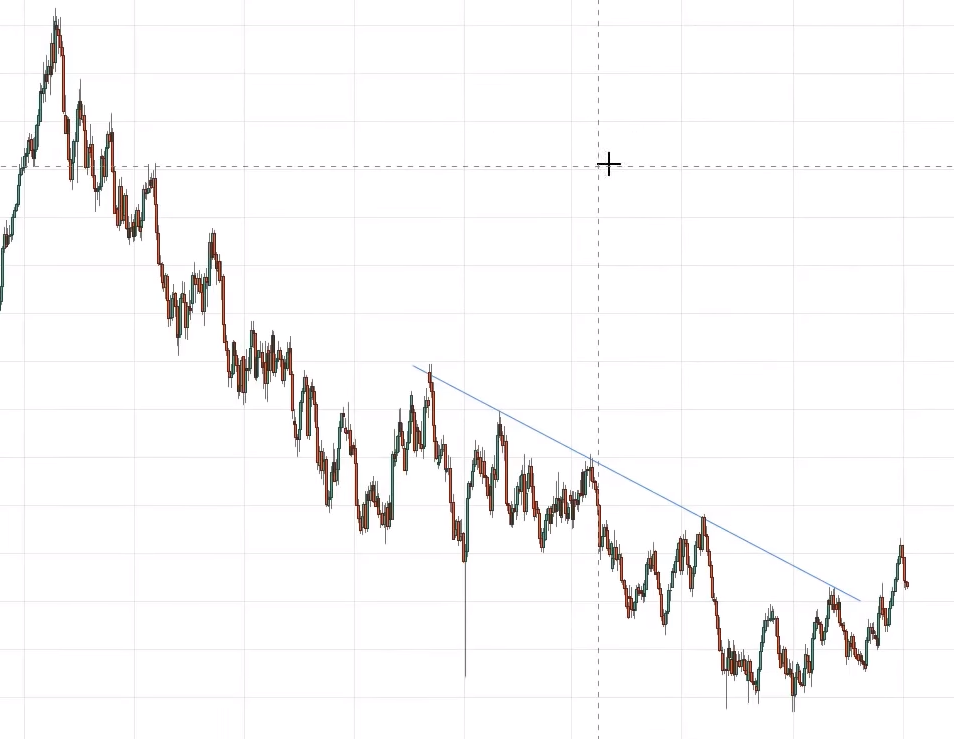
So at this point, you can see that AUDJPY I’m going to draw the line over here from right to left. So traditionally, how people do it, and it’s not wrong, it’s the draw it from left to right.
Then sometimes he might draw like this over here and you realize, this is broken. So I find that it's easier I draw from right to left because there is less of this type of corrections.
Let me share with you how I would do it, so right to left, click your trend line to this is the rightmost obvious swing high and fire back to the left side.
At this point, what you are trying to do is to get as many touches as possible. So this isn't perfect by any means. I want to do some slight tweaking as of right now.
So you can see that this high is being touched at the screen, but somehow this one is not touched over here, so what I could do is like a bring this one lower over here.
And at this point now I touched this level. This one is like a kind of like a false break, but still a valid touch.
If you asked me this was all right, it's still a touch and this is a touch as well.
So one thing to know about the trend line is they're just like support and resistance. Just like any other tool that you use to define an area of value.
We are dealing with areas on your chart. We are not dealing with a specific level on your chart. So you've got to treat this trendline as an area.
Something like this, where you can draw it like an area. So this is how you treat trendlines as an area on your chart
And a quick thing for you, If you want to visually help you look at it as an area, what it can do is click on this trendline "CTRL+C" then "CTRL + V."
Now you have another parallel line right there. You can attach to it, and treat it as an area
And for this parallel line, what I will do is I will try to touch it at the extreme ends of this trendline which is this one over here.
If we look at it this trend line, you can better visualize it as an area. And that's how I would go about drawing trend lines.
And if you want, you can even press ‘’control C’’ and ‘’control V’’, and we have another line parallel to it and treat it as an area.
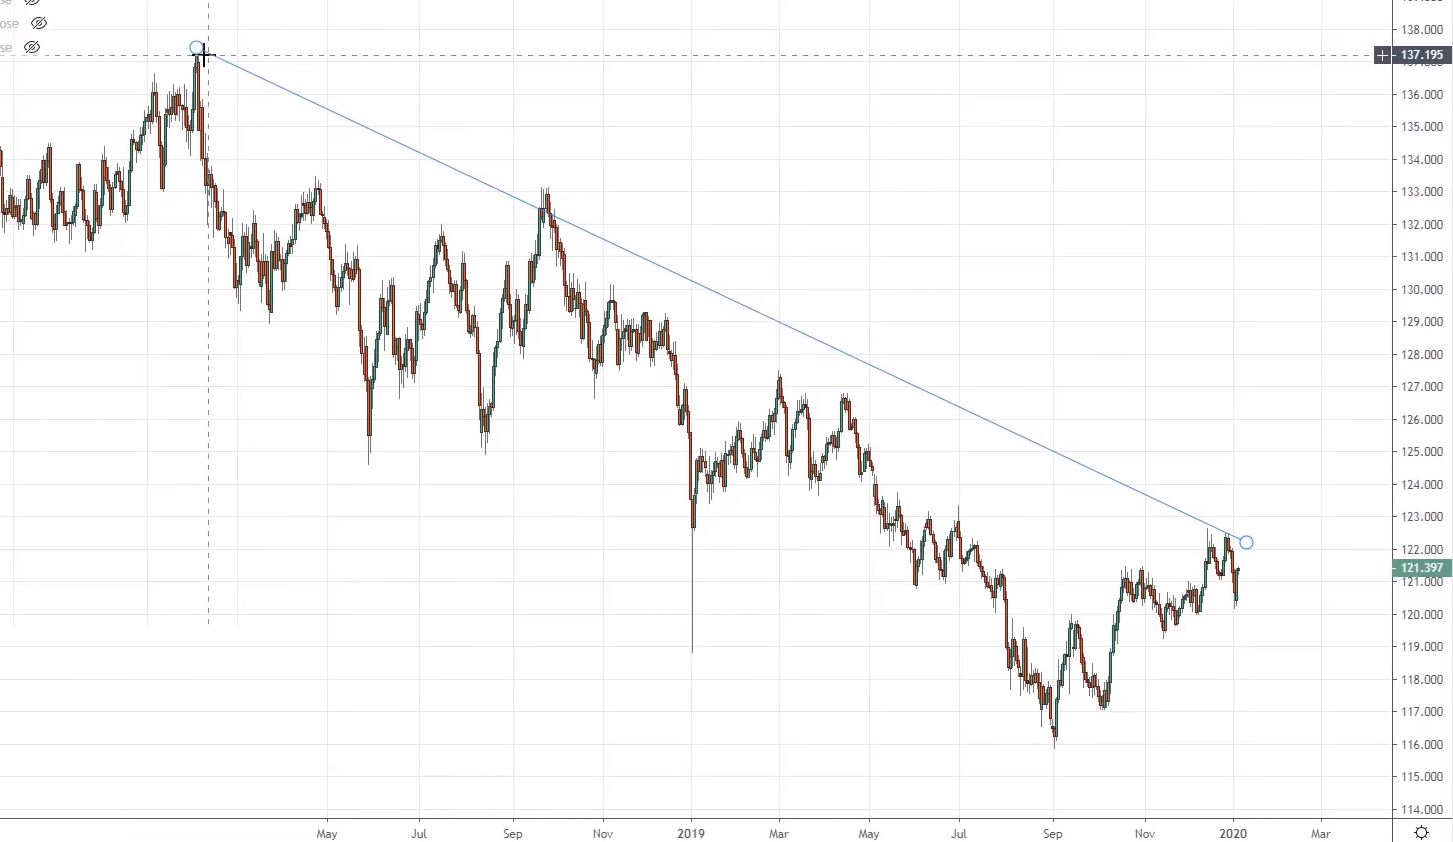
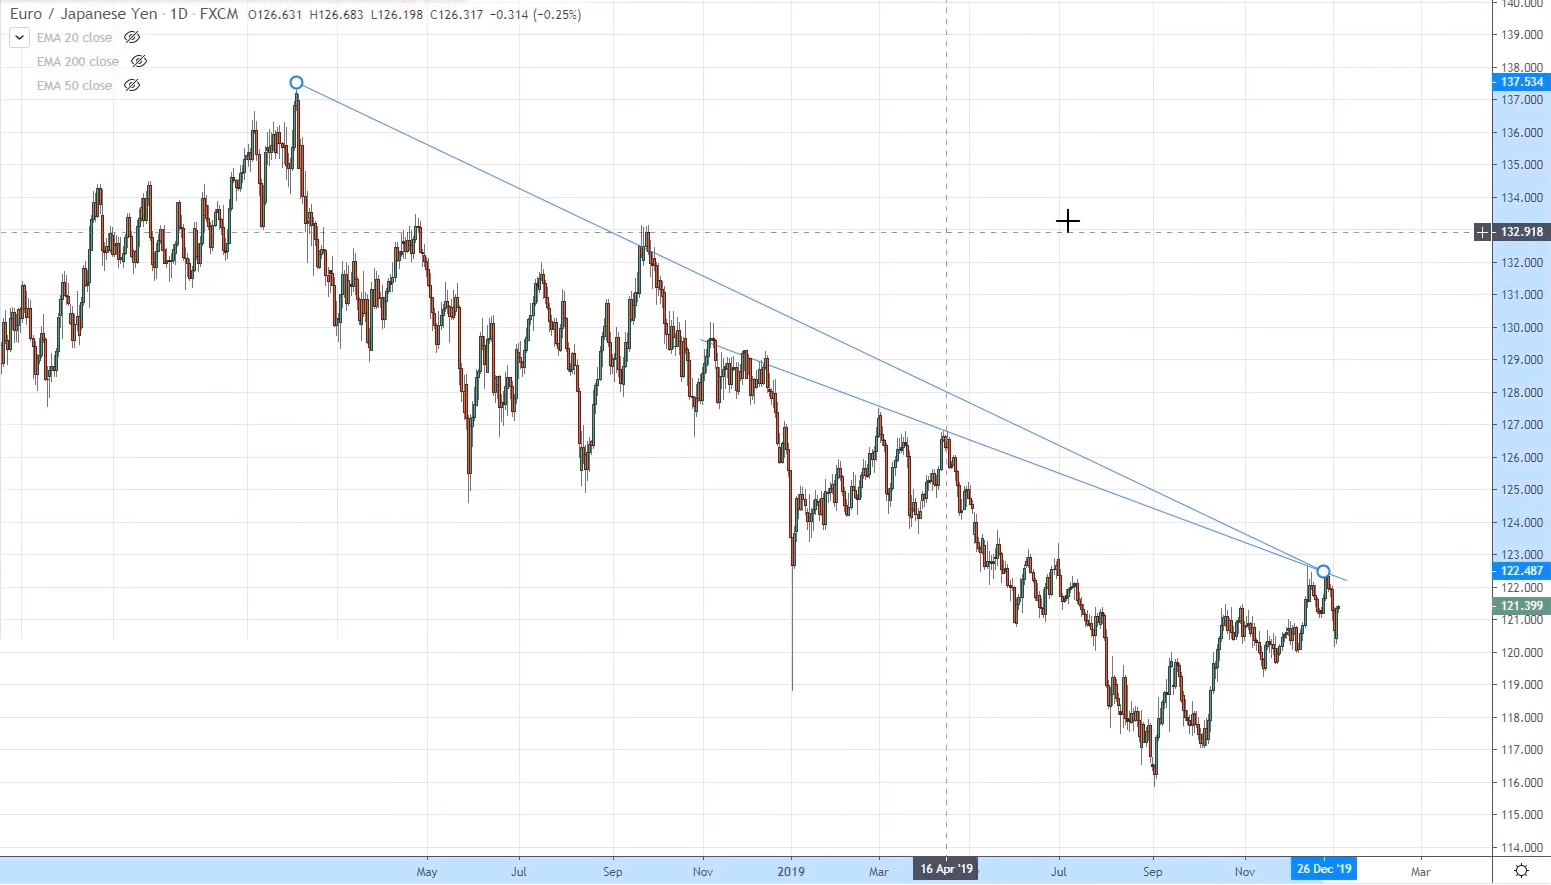
Example, EURJPY.
So as you can see over here, draw it from right to left. Pick the Trendline tool. This is the extreme highest point on the right side, fire it to the left.
You won't be perfect the first time around. So I'm going to make some tweaks to it. So at this point, this part over here is not involved, not involved yet.
Let's see if I can try to get it involved. If I were to bring this down it won’t quite make sense because it will invalidate this high.
So I'm to let this remain here. Okay. So what I'll do is possibly bring down this one lower and get involved this level and this one over here as well.
So you can see that I have not tweaked my trend line from this high over here. You can leave it at this highs, It's not wrong.
But I like to encompass, I like to give the more recent swing a so-called higher weighting tweak. I like to give it pressure, preferential treatment, I want to get them involved.
In this case, what I'll do is that since I could shift this down and get involved these two levels which are this one here and here:
This is how I would draw this trendline for this particular market. And again, it doesn't mean that this is the only correct trend line.
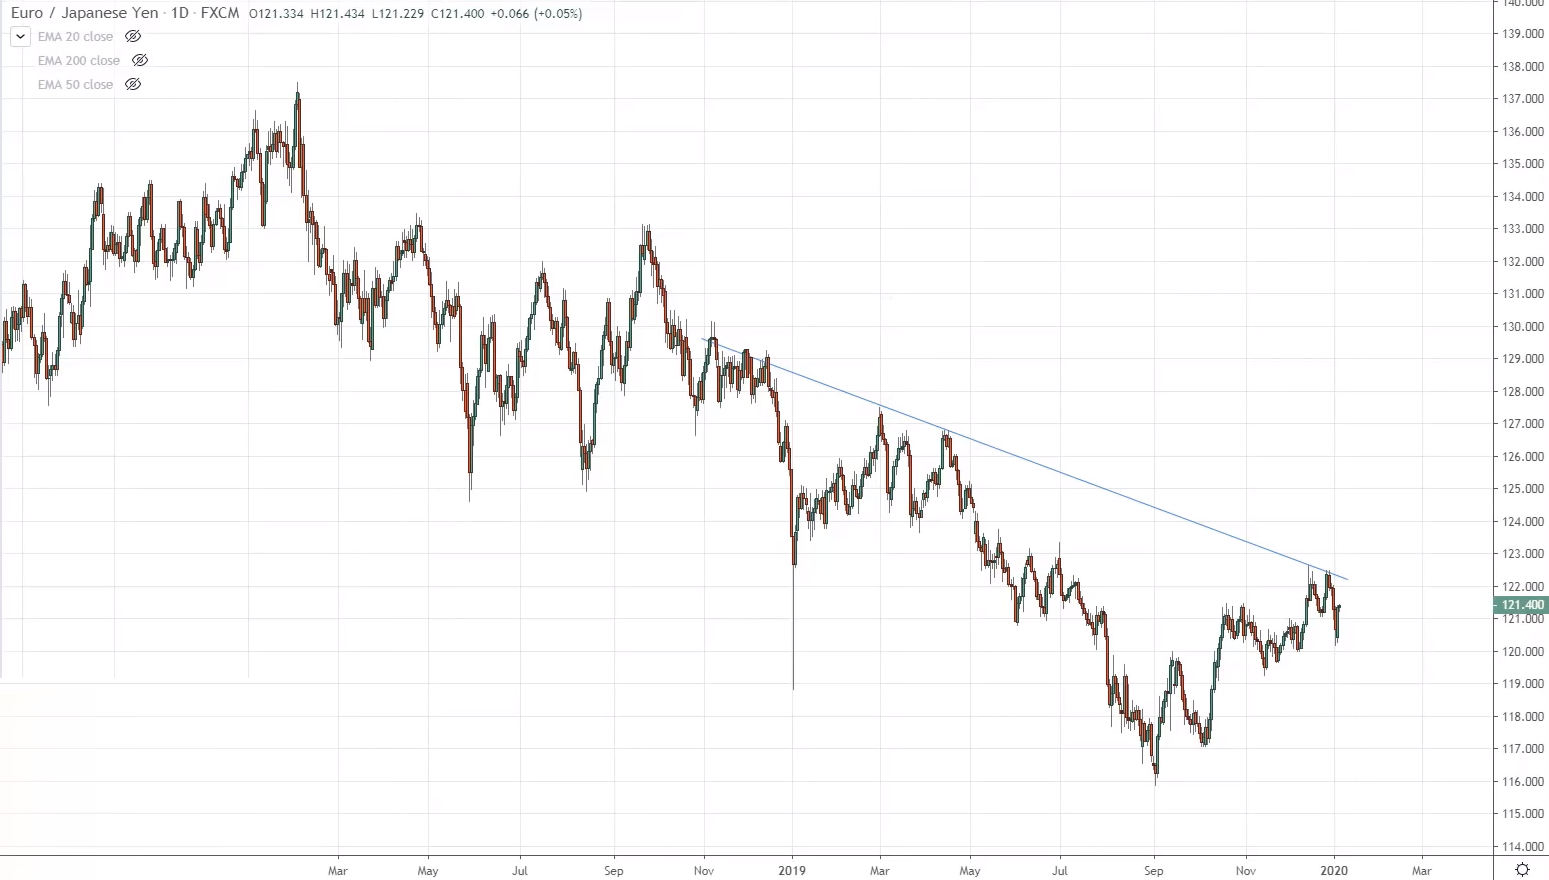
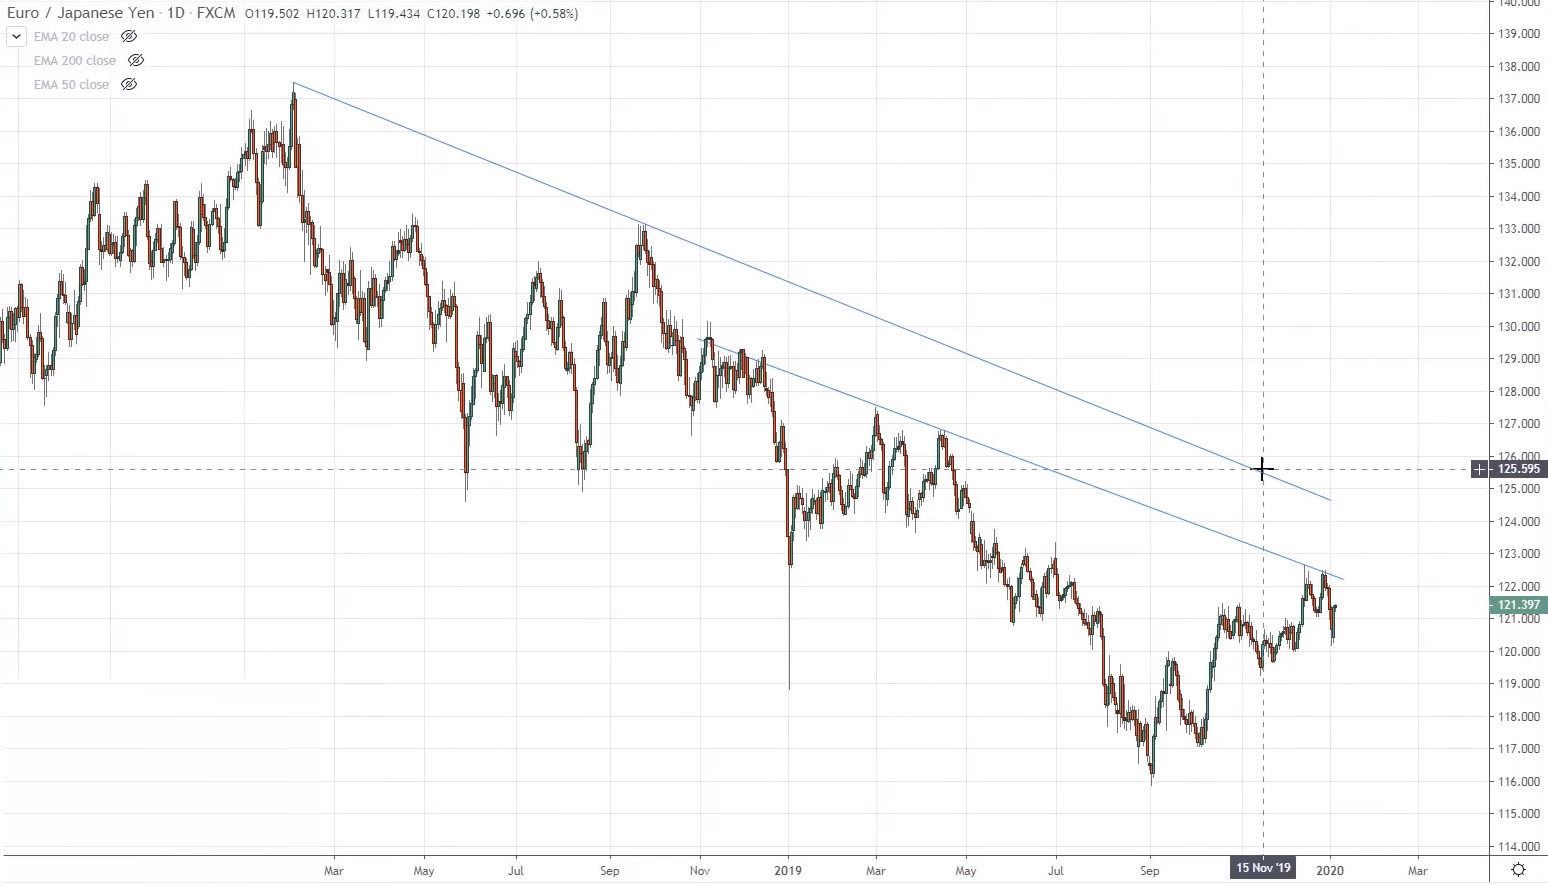
Because as you can see, right in the longer-term trend line, would be this one over here.
And you kind of like point towards a similar level. And if you project forward in time, you will be around the same level as well.
Again, as mentioned, I would rather give weightage to two of the more recent swing levels.
Another way you can draw a trend line again is to connect these two out, and you get something like this one over here.
There'll be another trend line over here. It is a point. This is also another valid trend line.
If you draw from right to left or this one, you'll start from here to here and then you extend this one down.
But I'll be more concerned with the recent price action. So I will just leave this trend line over here, and this will be the one that I'll be watching as of right now.
I give more ratings to the recent price action, and this is how I would draw this trend line at this point for EURJPY.
Because as I mentioned, I give more weightage to the recent highs, the recent lows, the recent price action.
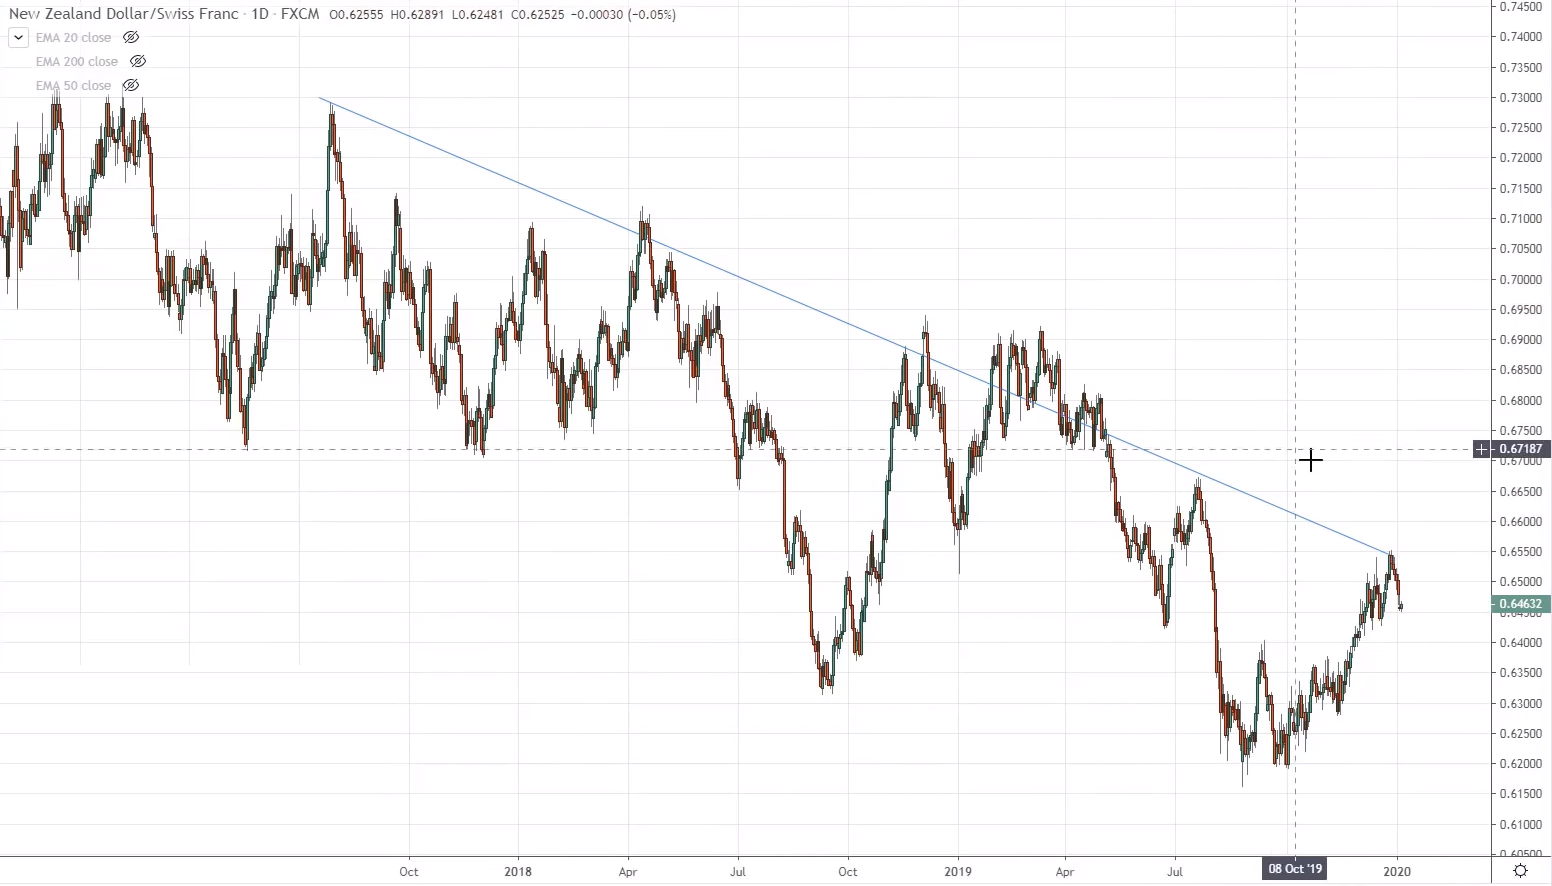
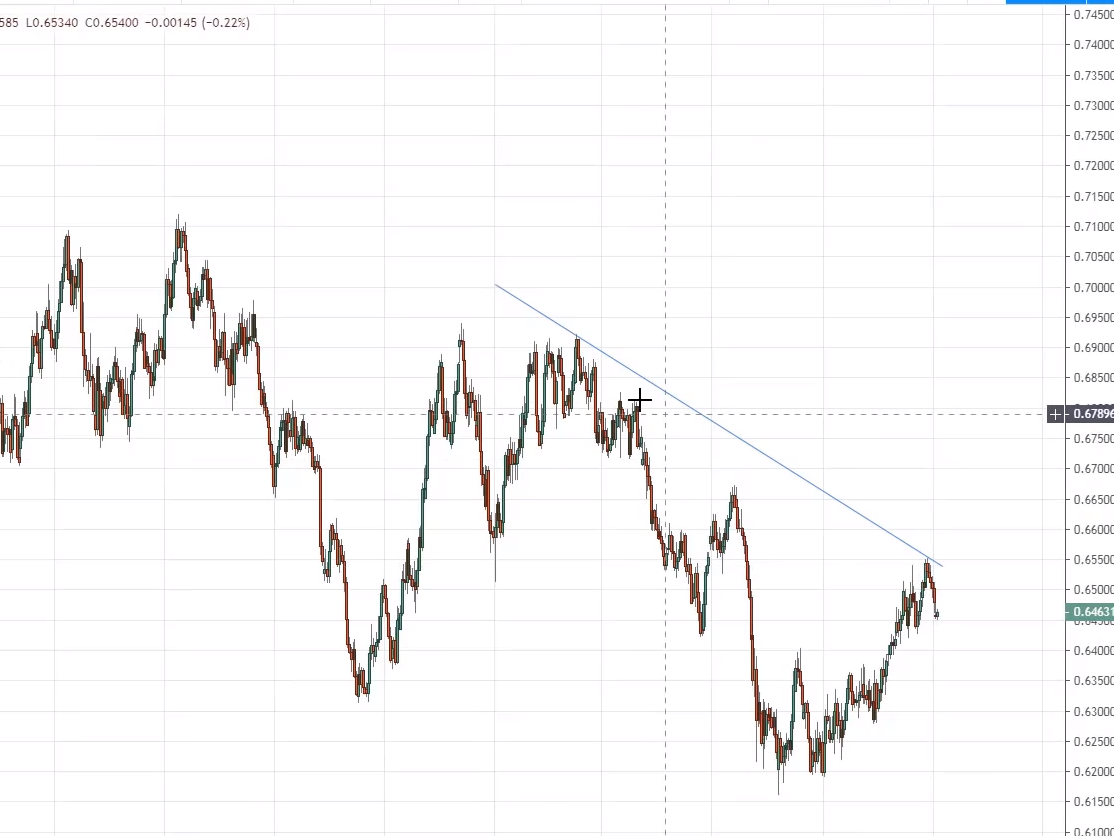
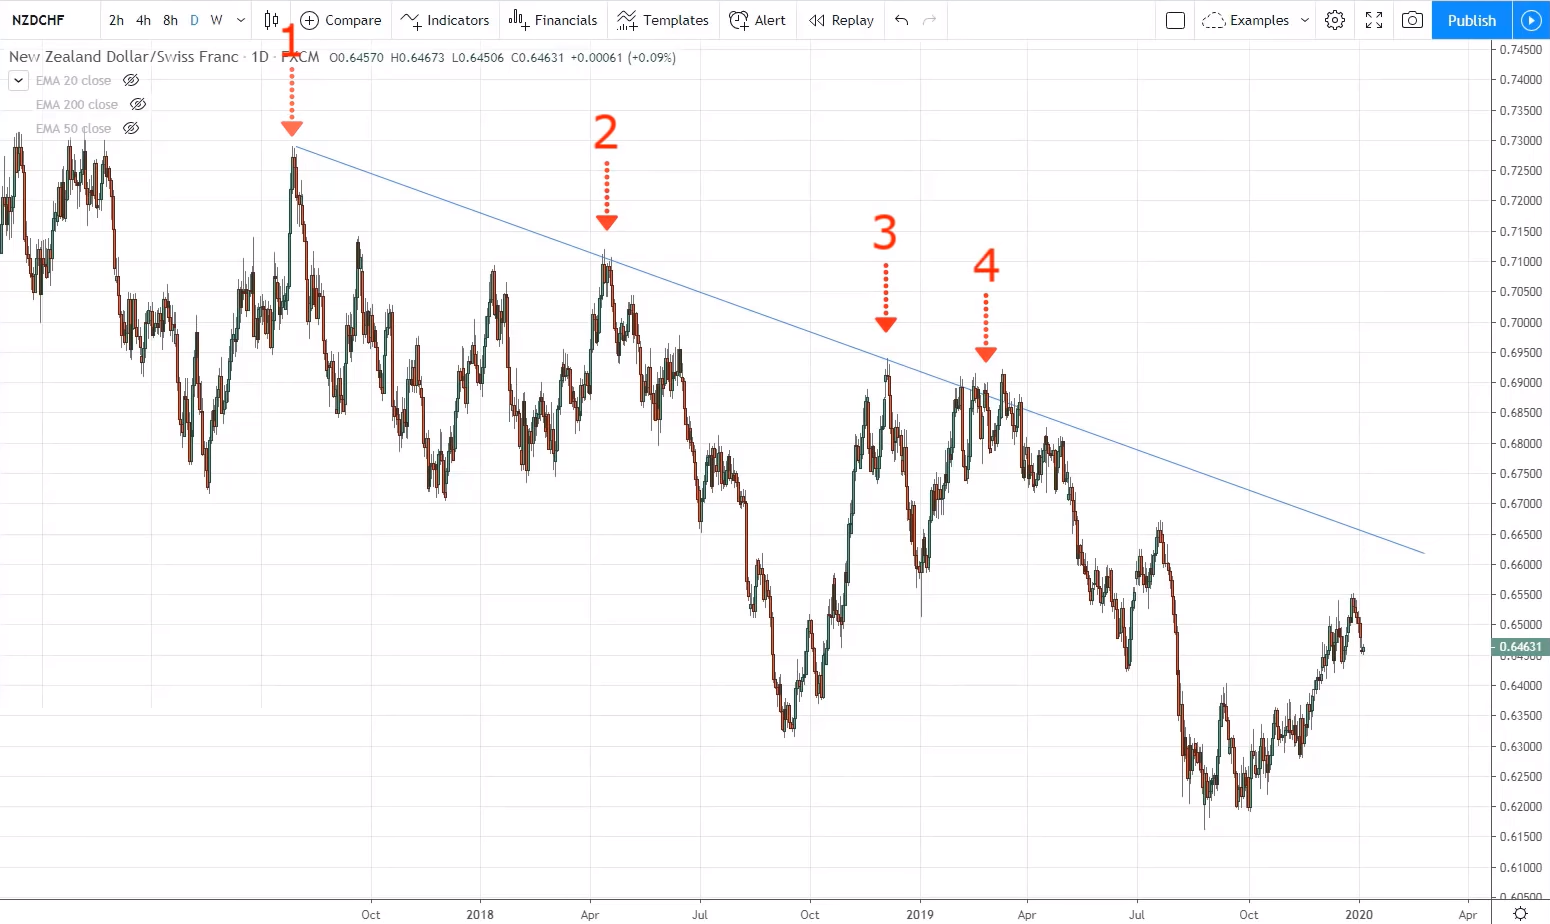
Just one last example again NZDCHF.
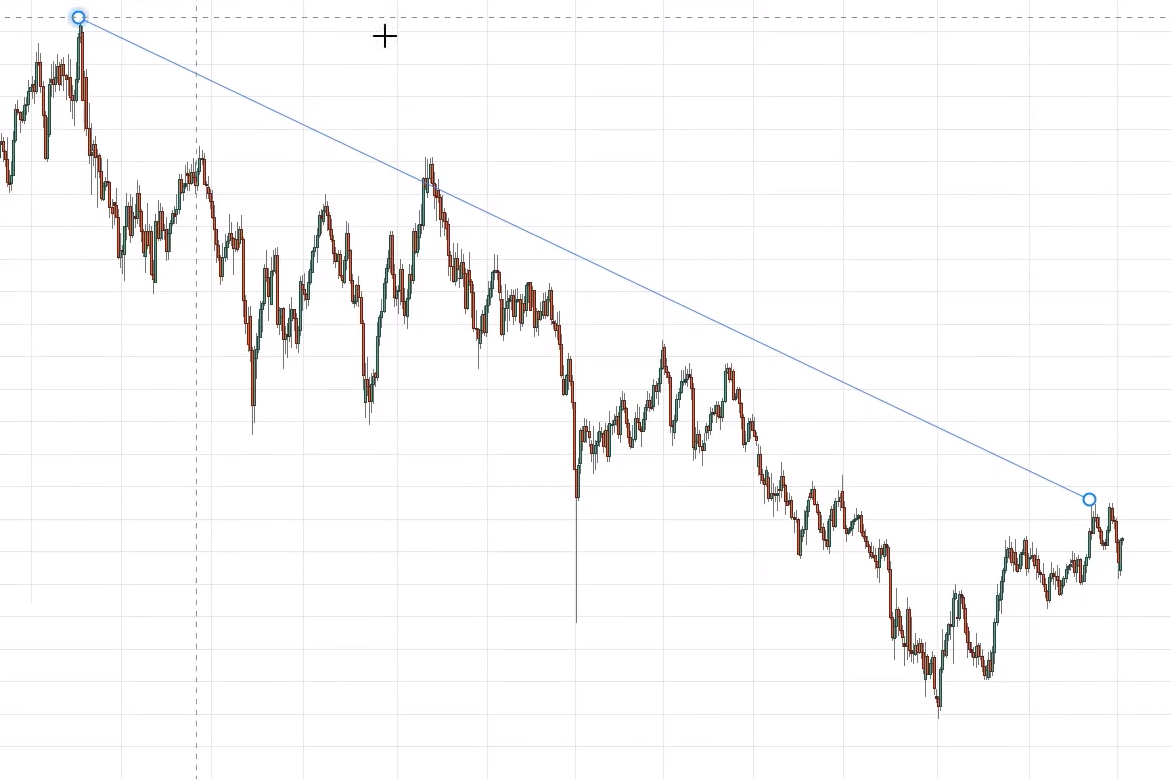
Again, the same technique, zoom out and plot, I like to do from right to left, pick your trend line tool from then from the extreme highs, go all the way and try to get as many touches as possible.
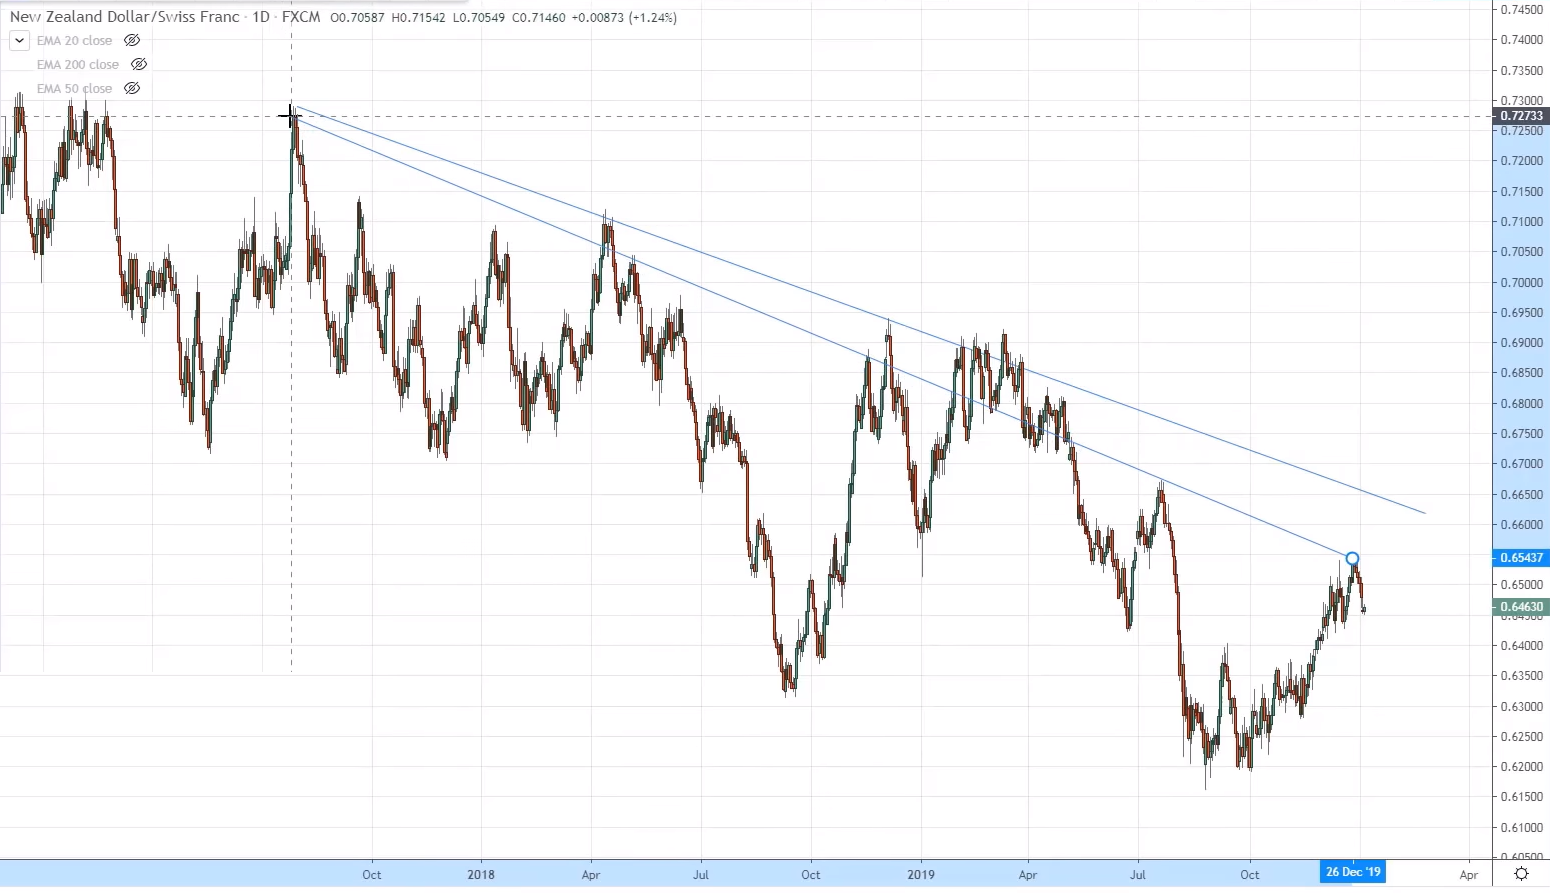
So at this point, you can see that this is a quite number of touches but invalidates this entire portion over here, which is the more recent level, so what I'll do is I will adjust it.
And taking into account the recent level.
So I'll possibly do something like this:
If I were to consider these highs, I only have two points.
I could get several touches compared to the other approach to adjust analyzed. So for this approach, I get one-touch two, three and four.
This is the most number of touches, body, and wick. So I will go with this particular trend line instead of this most recent one here.
So if you want to draw this, I only have one touch. it's the only one here and two here:
If I were to connect this one here in this manner, you can see that there's a lot of invalidation points that disrupt this trend line.
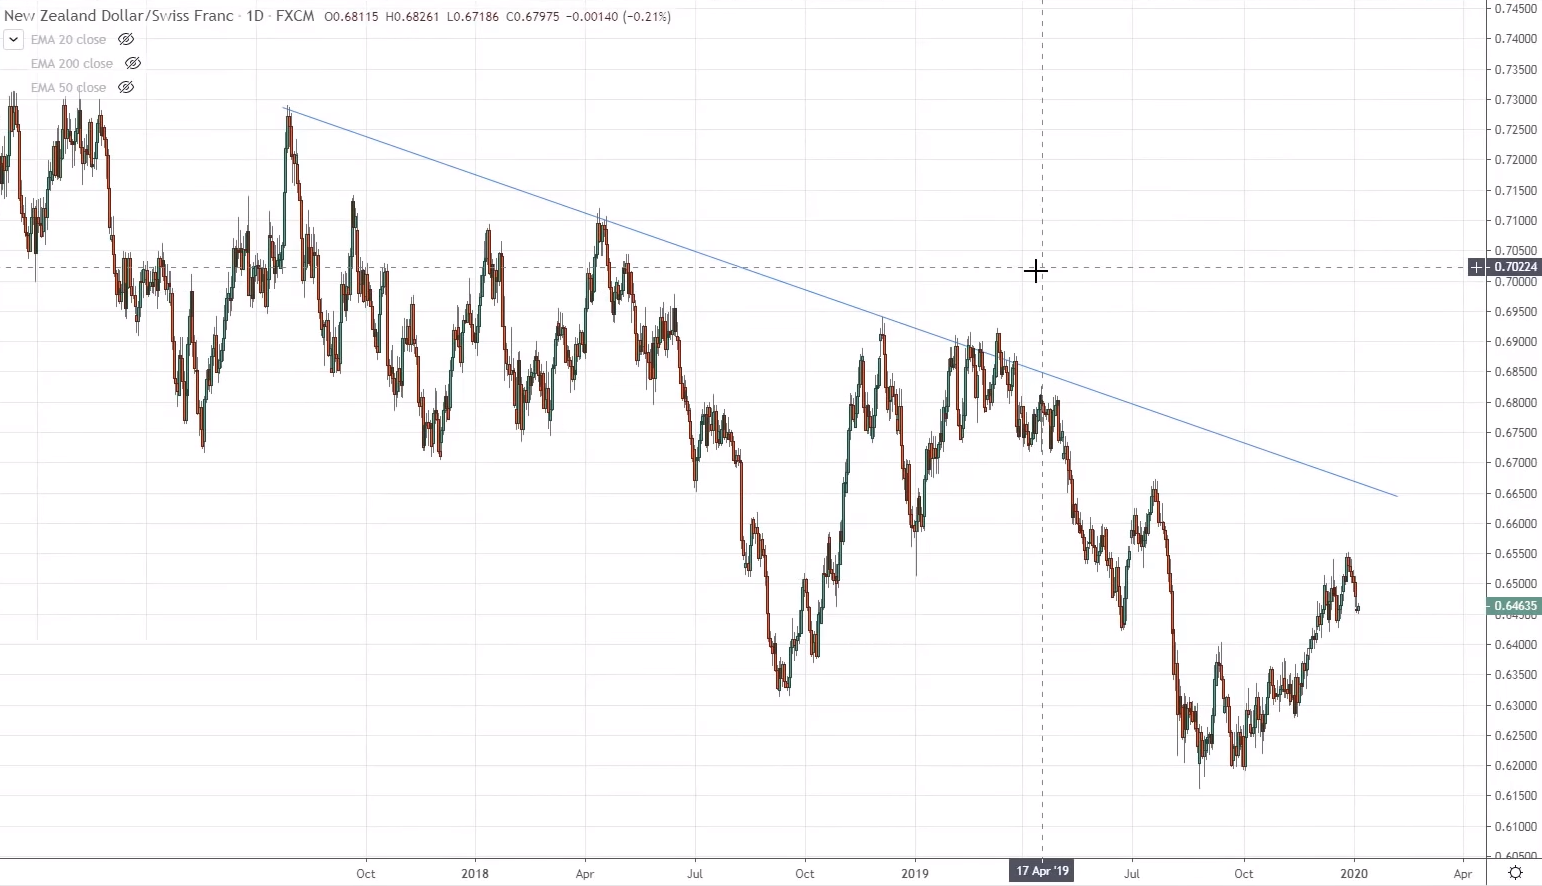
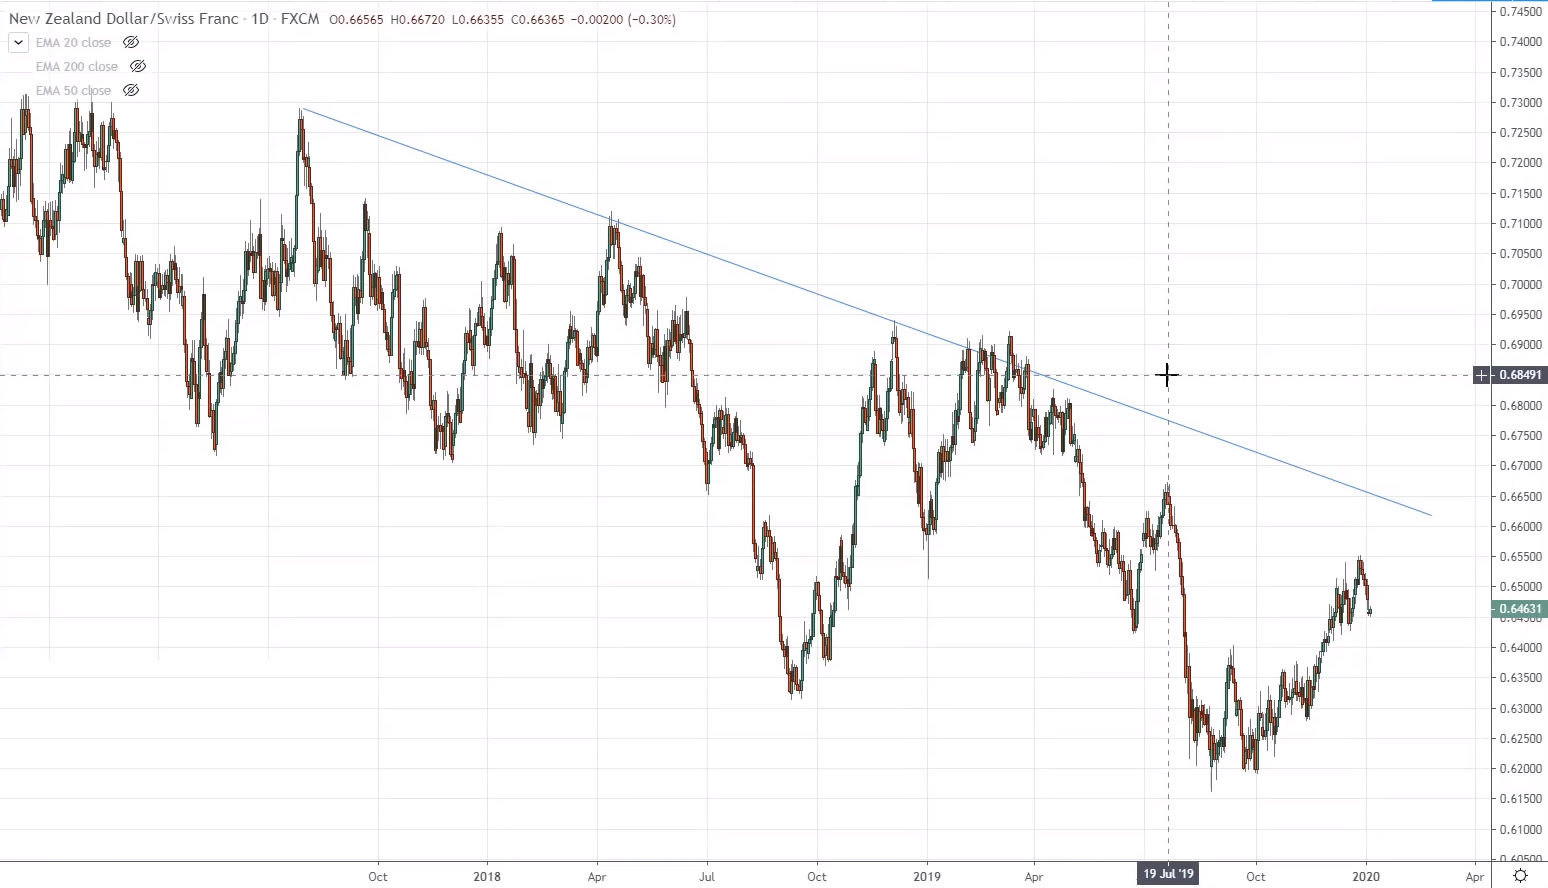
So I'll remove this, and keep this trend line here. At this point for this chart, this will be the trend line I will reference from:
Why is that again?
It has the most number of touches, and that's the biggest criteria. When we are taking account drawing of trend lines, as well as the most recent price action.
So the most recent price action had only two bounce of a trendline, whereas if I go further back in time, I get like four or five bounce.
I will go back further in time and get the most number of touches. So this is how I would go about drawing trend lines.
Moving on…
How do you use the trend line in your trading?
Let's find out. How do you use this tool to trade the markets?
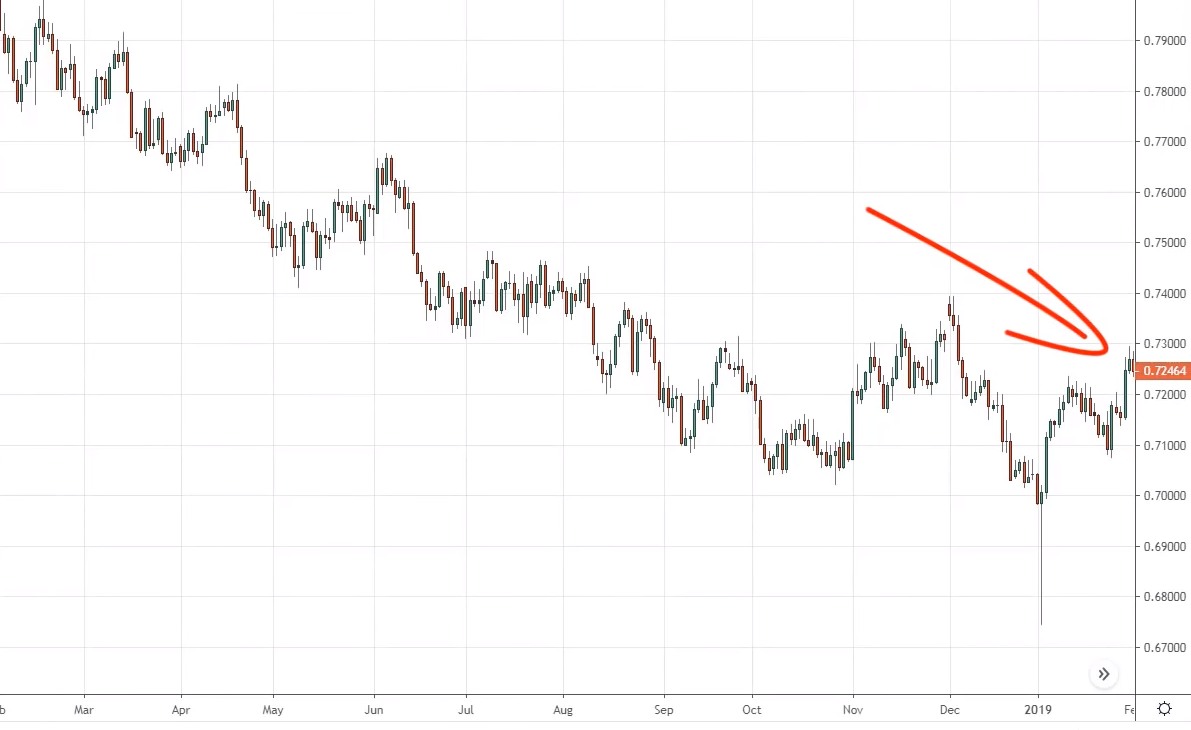
This is the AUDUSD dollar.
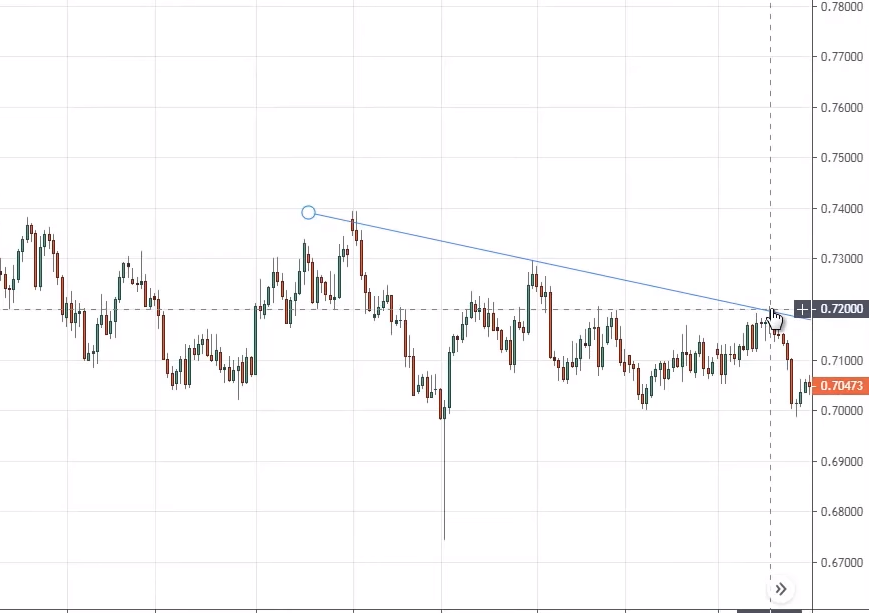
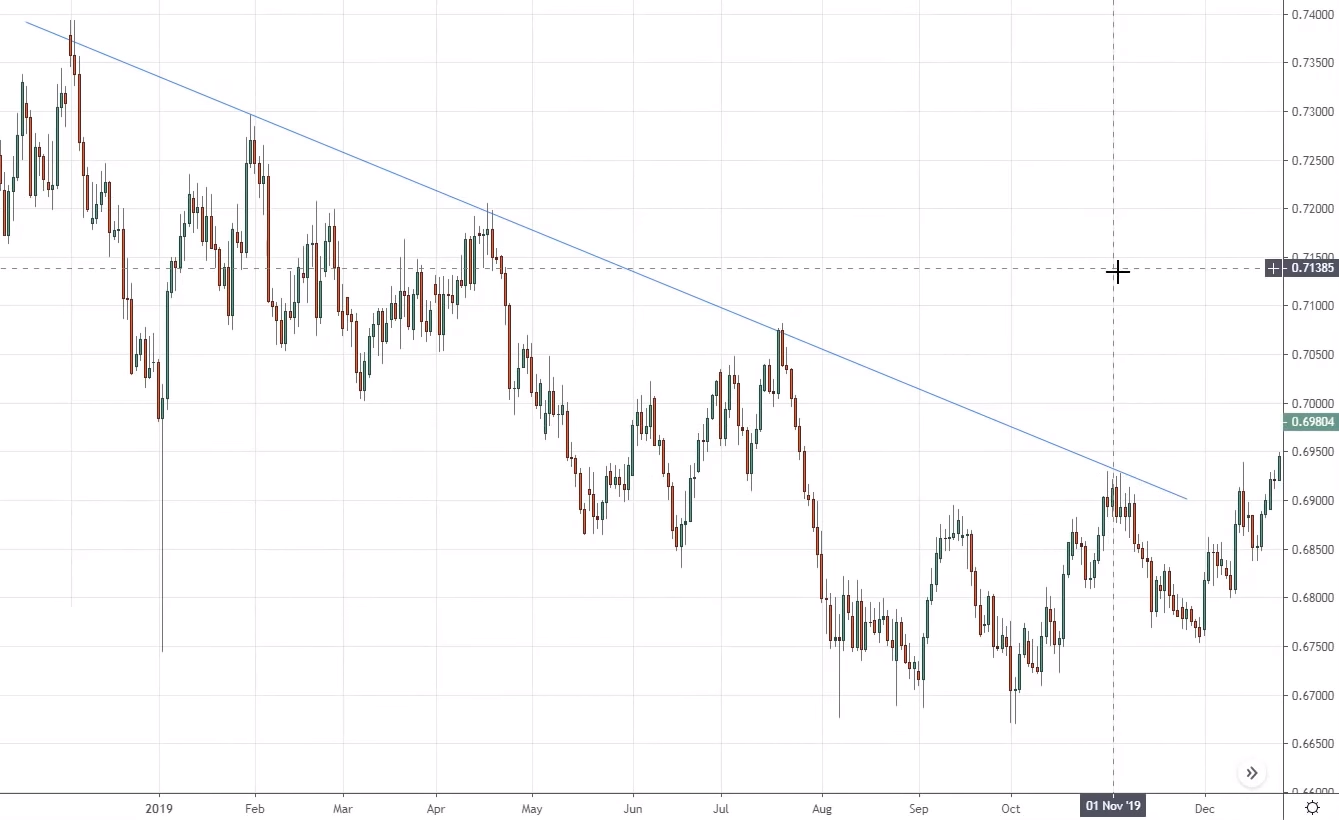
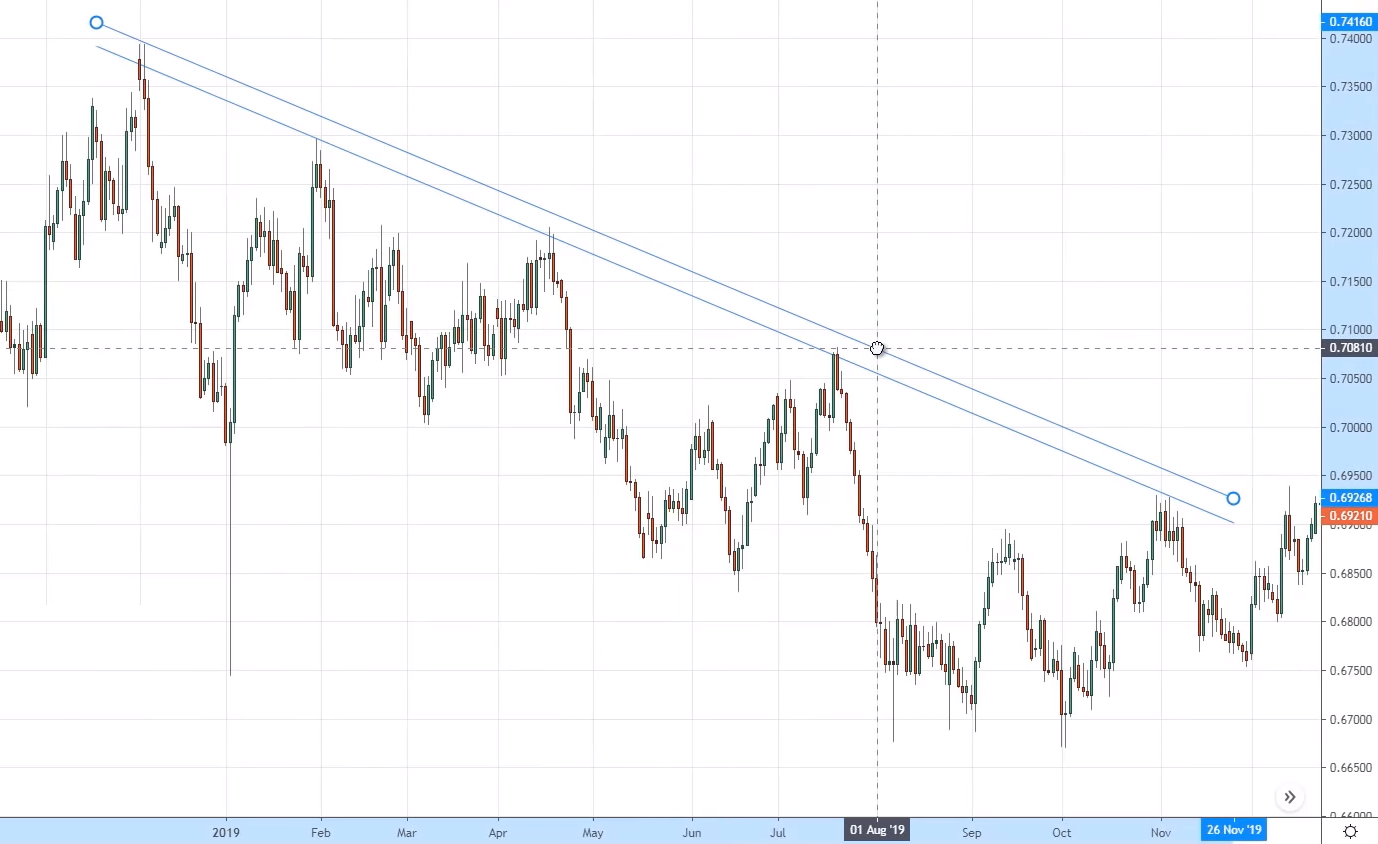
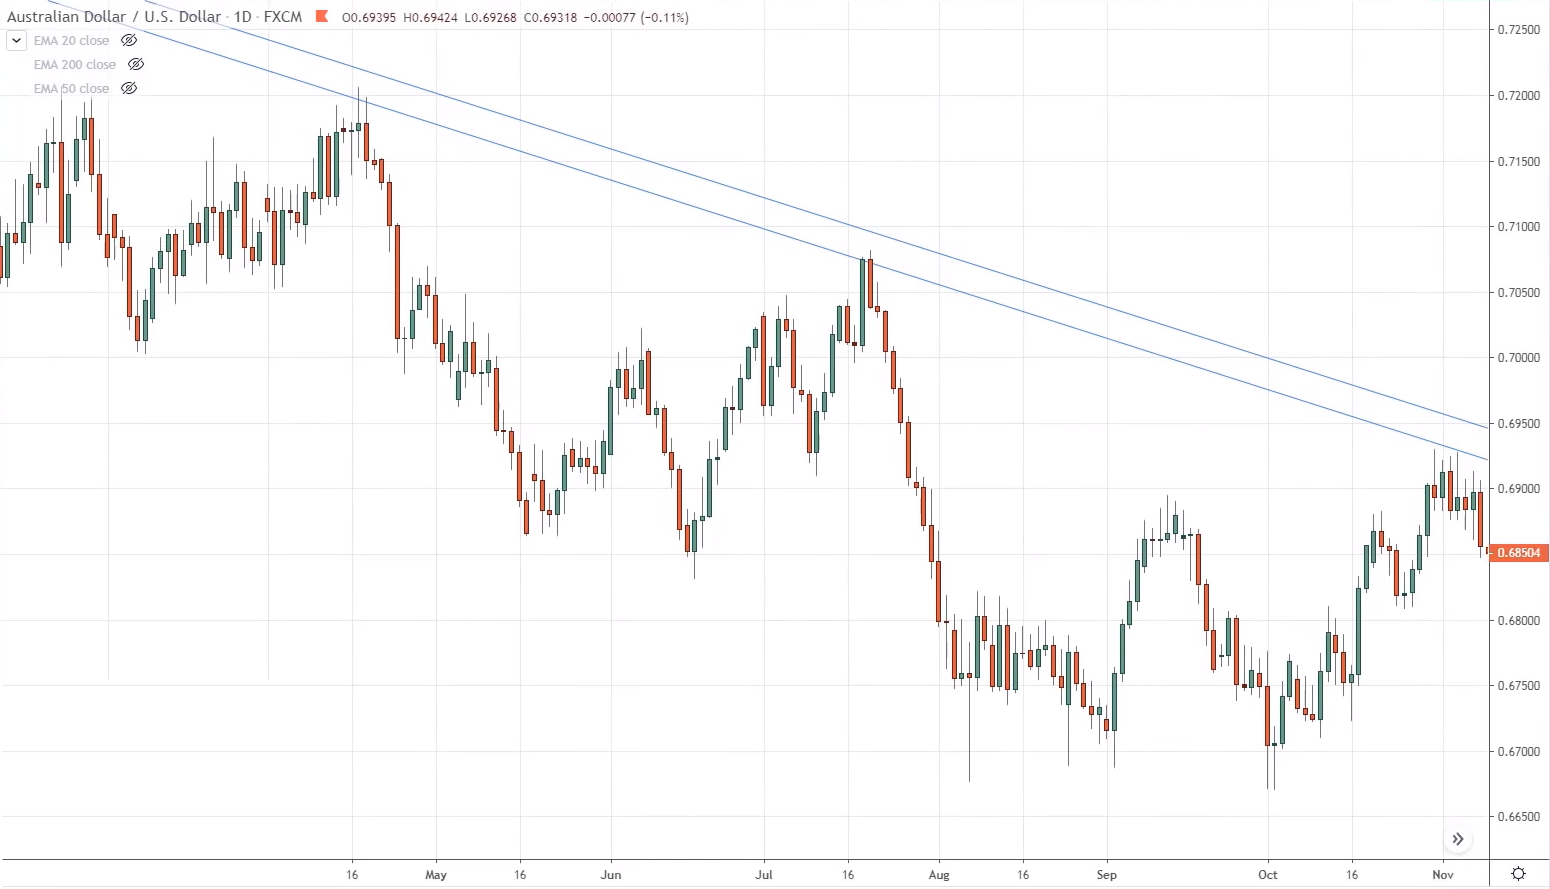
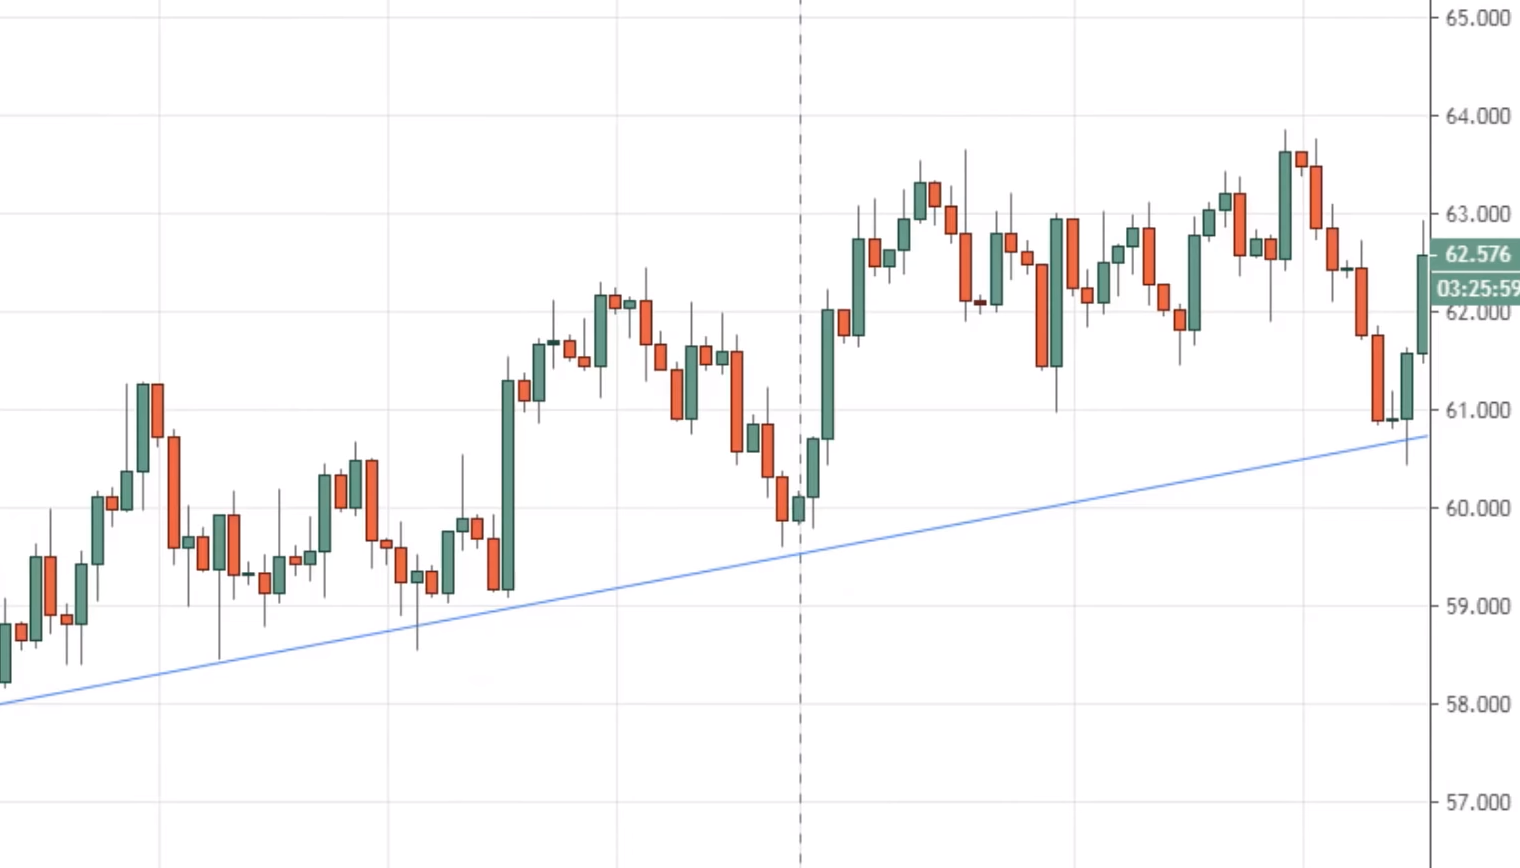
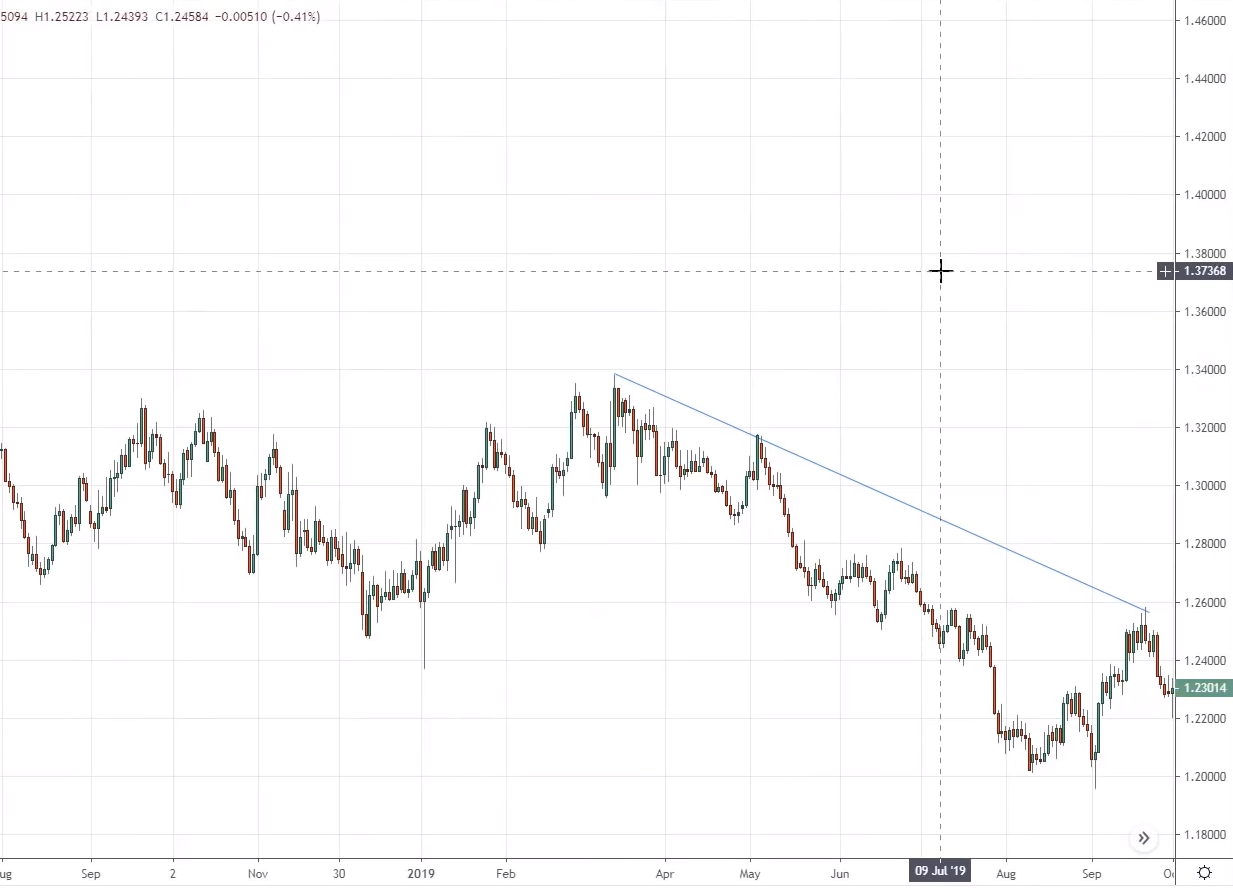
You can see over here, I have drawn this trend line over here, number of touches, 1-4 touches. And this one over here is the fifth one.
So when you trade trendlines. It's only confirmed right after the market has bounced the trendline off at least twice.
For example, if I were to look at the chart, I know many traders would say
‘’Oh, Rayner, the market has bounced over here on the trend line, I go short at this point’’.
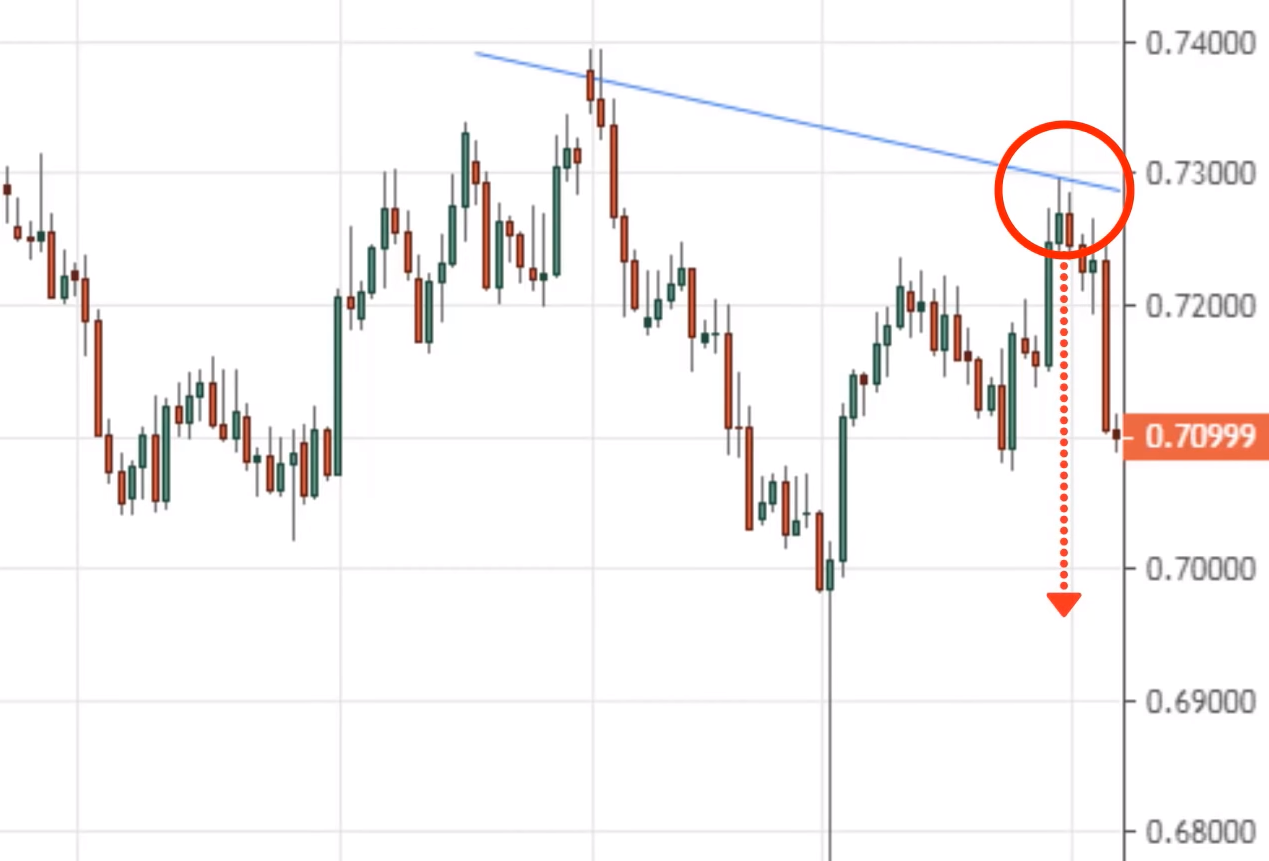
No, you can’t, because, at this point, you couldn't even draw the trend line, because, at this level, it has not reversed from this level.
You don't even know whether the market or rather you can’t even draw the trend line because if you look at this, at this point, you only have one point in the market.
which is this level over here. How do you know to draw, connect these highs over here when the market hasn't even reacted to this high?
So you have no idea that you will draw the trend line to connect in his highs. Does it make sense?
You can only sort of like draw the trendline after the prices bounce off the trendline at least two times...
So for this one here, it bounced ones, twice, then the third time when you draw the trendline when it comes back the third time, only then can you decide whether this is an area you want to trade from.
Whenever you trade trendlines, remember you need at least two tests of it. To kind of confirm the trendline, if there's only one bounce of it, it is not even possible to draw a trendline.
I want you to focus on this portion over here. When you trade trend line, bear in mind that you're dealing with an area on the chart.
You have no idea at which particular point of the area would it reverse from. Would it be before or after the trend line?
For example:
Let's say we are dealing with an area, I can copy and paste ‘’CTRL + C’’ and ‘’CTRL + V’’ and say that we are dealing with this area of the trend line on your chart.
The question is ‘’Hey Rayner, how do I know which part of the area the price will bounce from?’’
What he be at the earliest point of the line? Or would it retrace deeper? And reverse from here?
The thing is you don't know, you never know. That's why you let the price tell you right when to get it right. You let price be your guideline and that’s what we will do down here.
In this case, the price has given us clues. The market is about to reverse a lower came back at once, give you kind of like a shooting star pattern.
This is a price rejection:
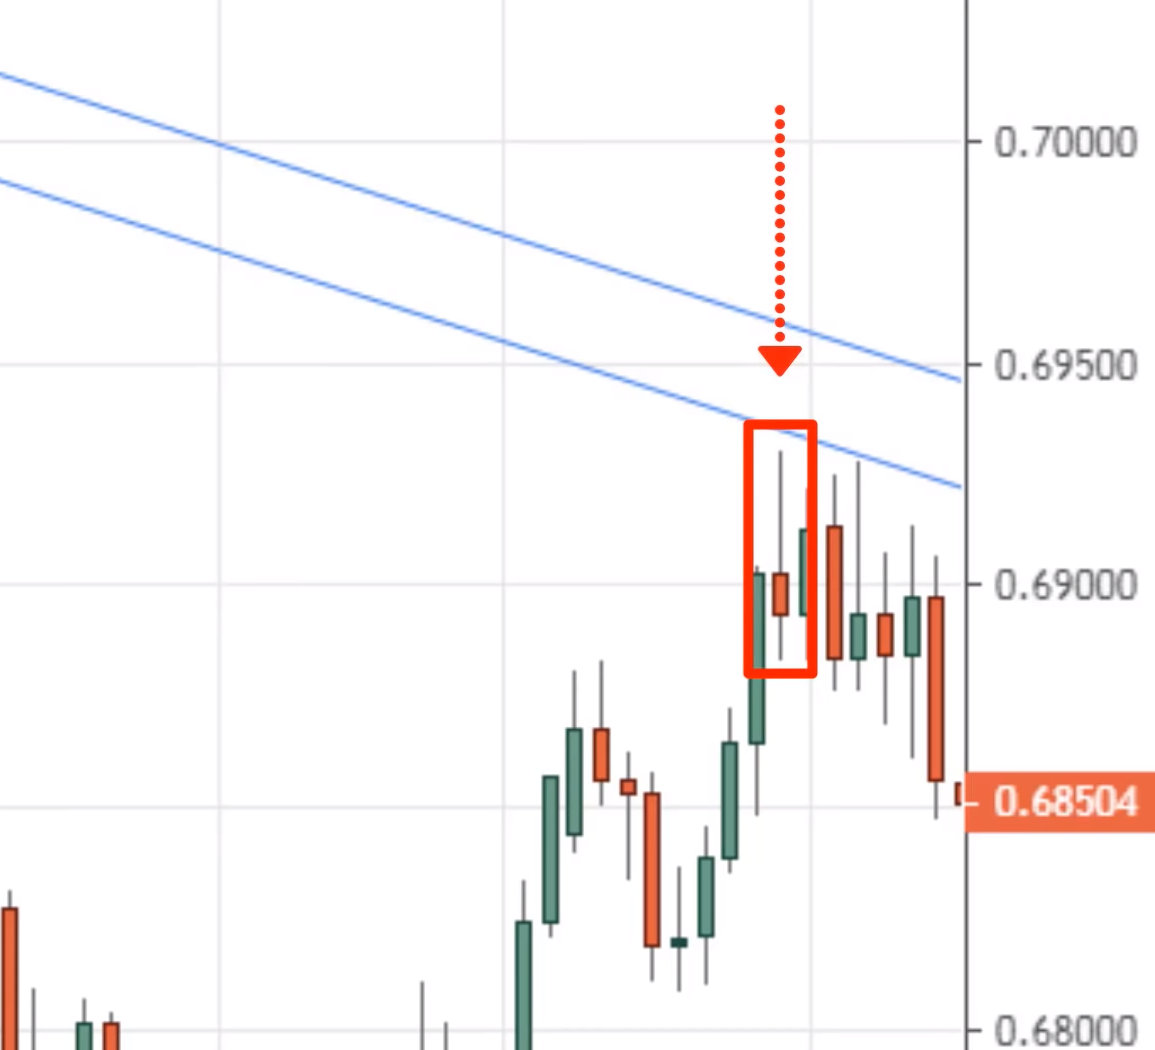
The second candle market tried to close higher and It forms a bearish engulfing pattern and telling you that the sellers are in control.
The fourth candle over here, this is another form of price rejection, buyers try to push the price up near this high only to get rejected and closing near the lows.
So at this point, there are multiple price rejection rates, multiple price rejection in this area.
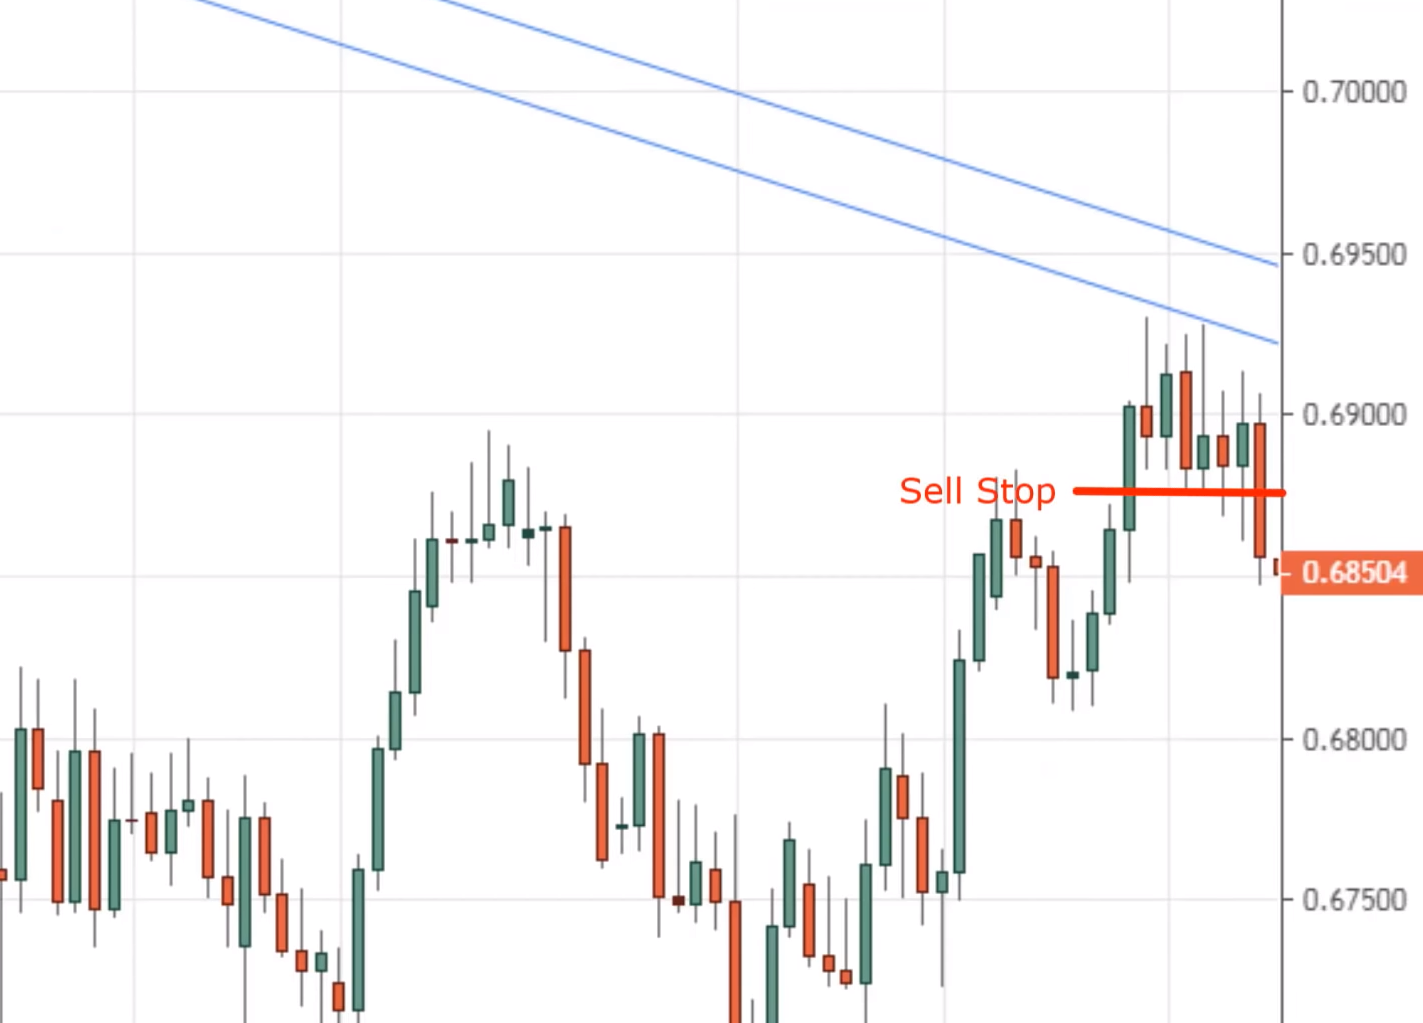
At this point, if you see multiple price rejection at this swing high and this area of resistance, shown by the trendline, this is a sign of weakness and you might want to consider selling right in this market condition.
Where do you sell it?
What it can do is just place a sell stop other below this swing low and to get you to trigger right towards a short side in this market...
So this is one type of an entry trigger a pattern to get you to do a short this market using trend lines.
Because remember you have no idea where and which part of the trend line the market is going to reverse whether the early portion of the trend line or the later portion.
Where the price breaks do a false brick of the trendline and then reverse lower.
So since you have no idea, you let price be your guide, you watch the price action, you look at how the price gets rejected to time your entry.
Another Example BCOUSD
This time around we will have a look at the 8HR timeframe. Again, same thing so at this point, if I just go over here at this point, there is no way you are going to buy it over here.
Because the trend line is not being formed yet. So likewise at this point, it's also unlikely you'll buy over here.
Why is that?
Because if you thinking about this, when the price is over here. How you draw this trendline now will look something like this.
Maybe you could buy it over here. But you can see that from the start, where you draw the trend line and maybe after a hundred candles later, your trendline will go through different iterations and variations.
So you constantly tweak it, to adjust it to the current state of the market, bear it in mind...
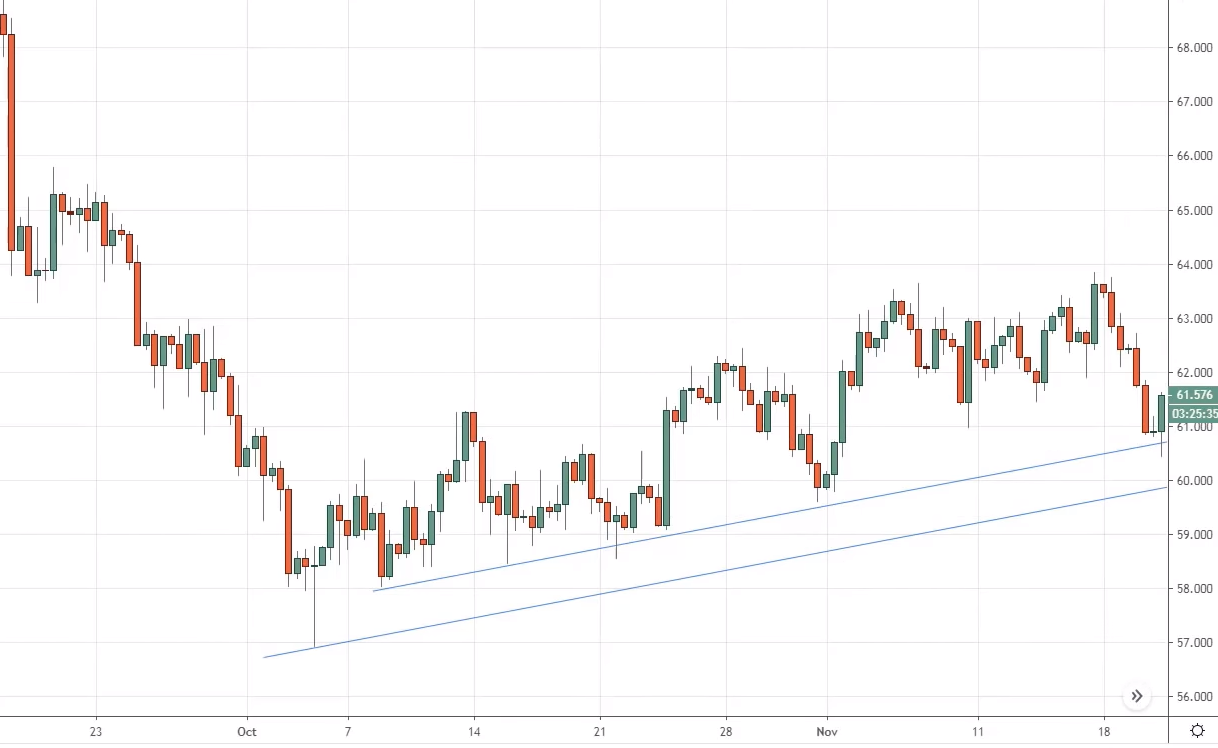
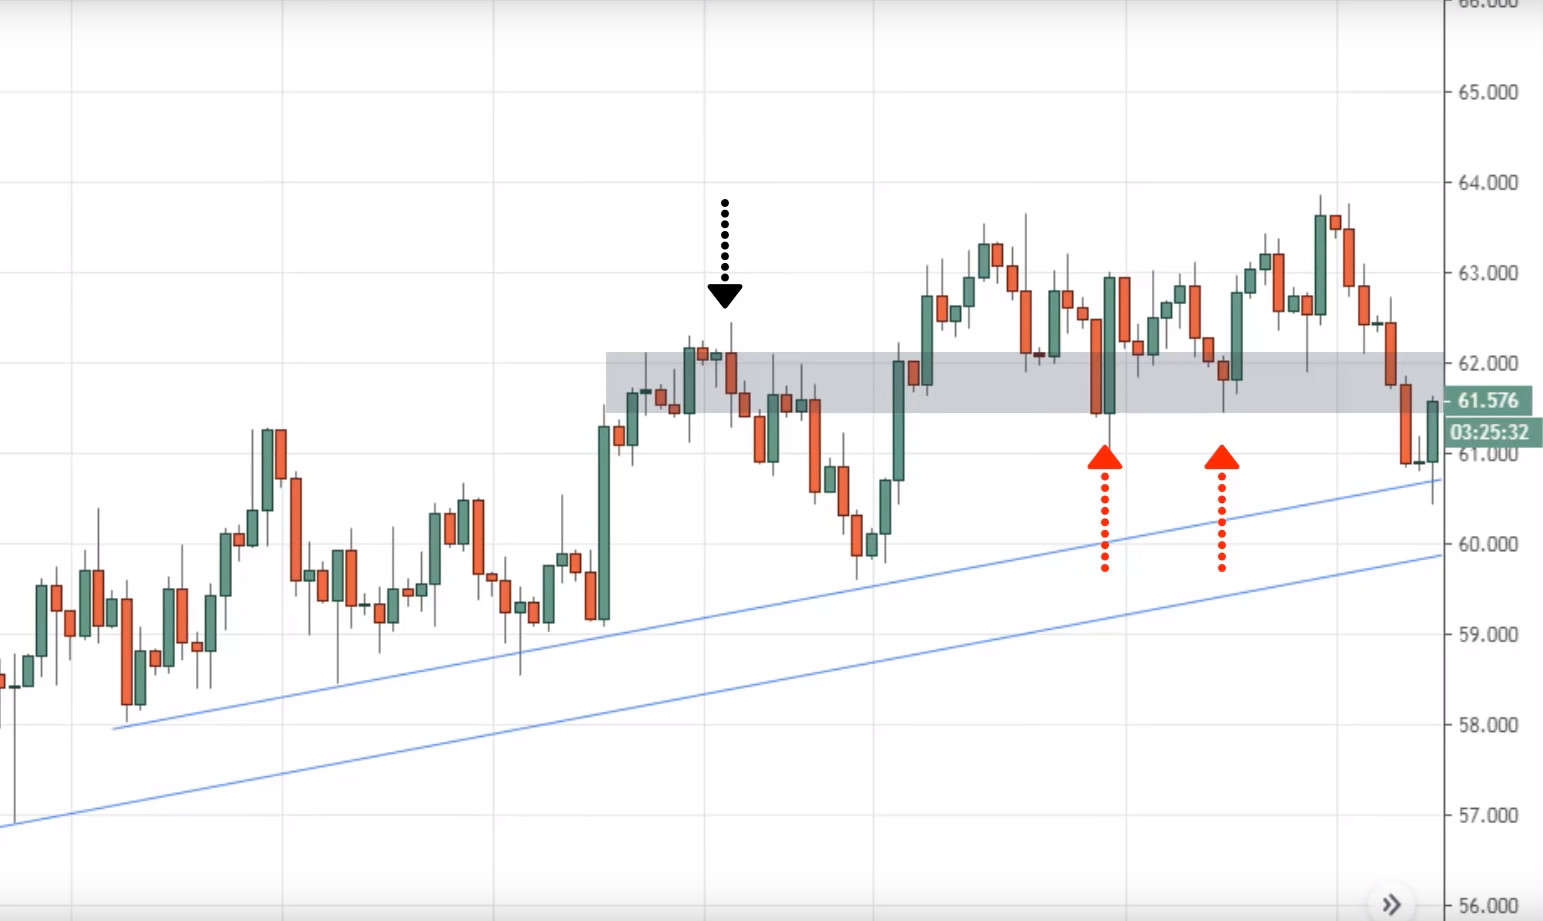
At this point, the current state of the market, how I would draw this trend line is like this. You can see that price again, bounce off once over here.
Breaks above this high came back, bounce a second-time break above this highest bounce a third time, break up above this high.
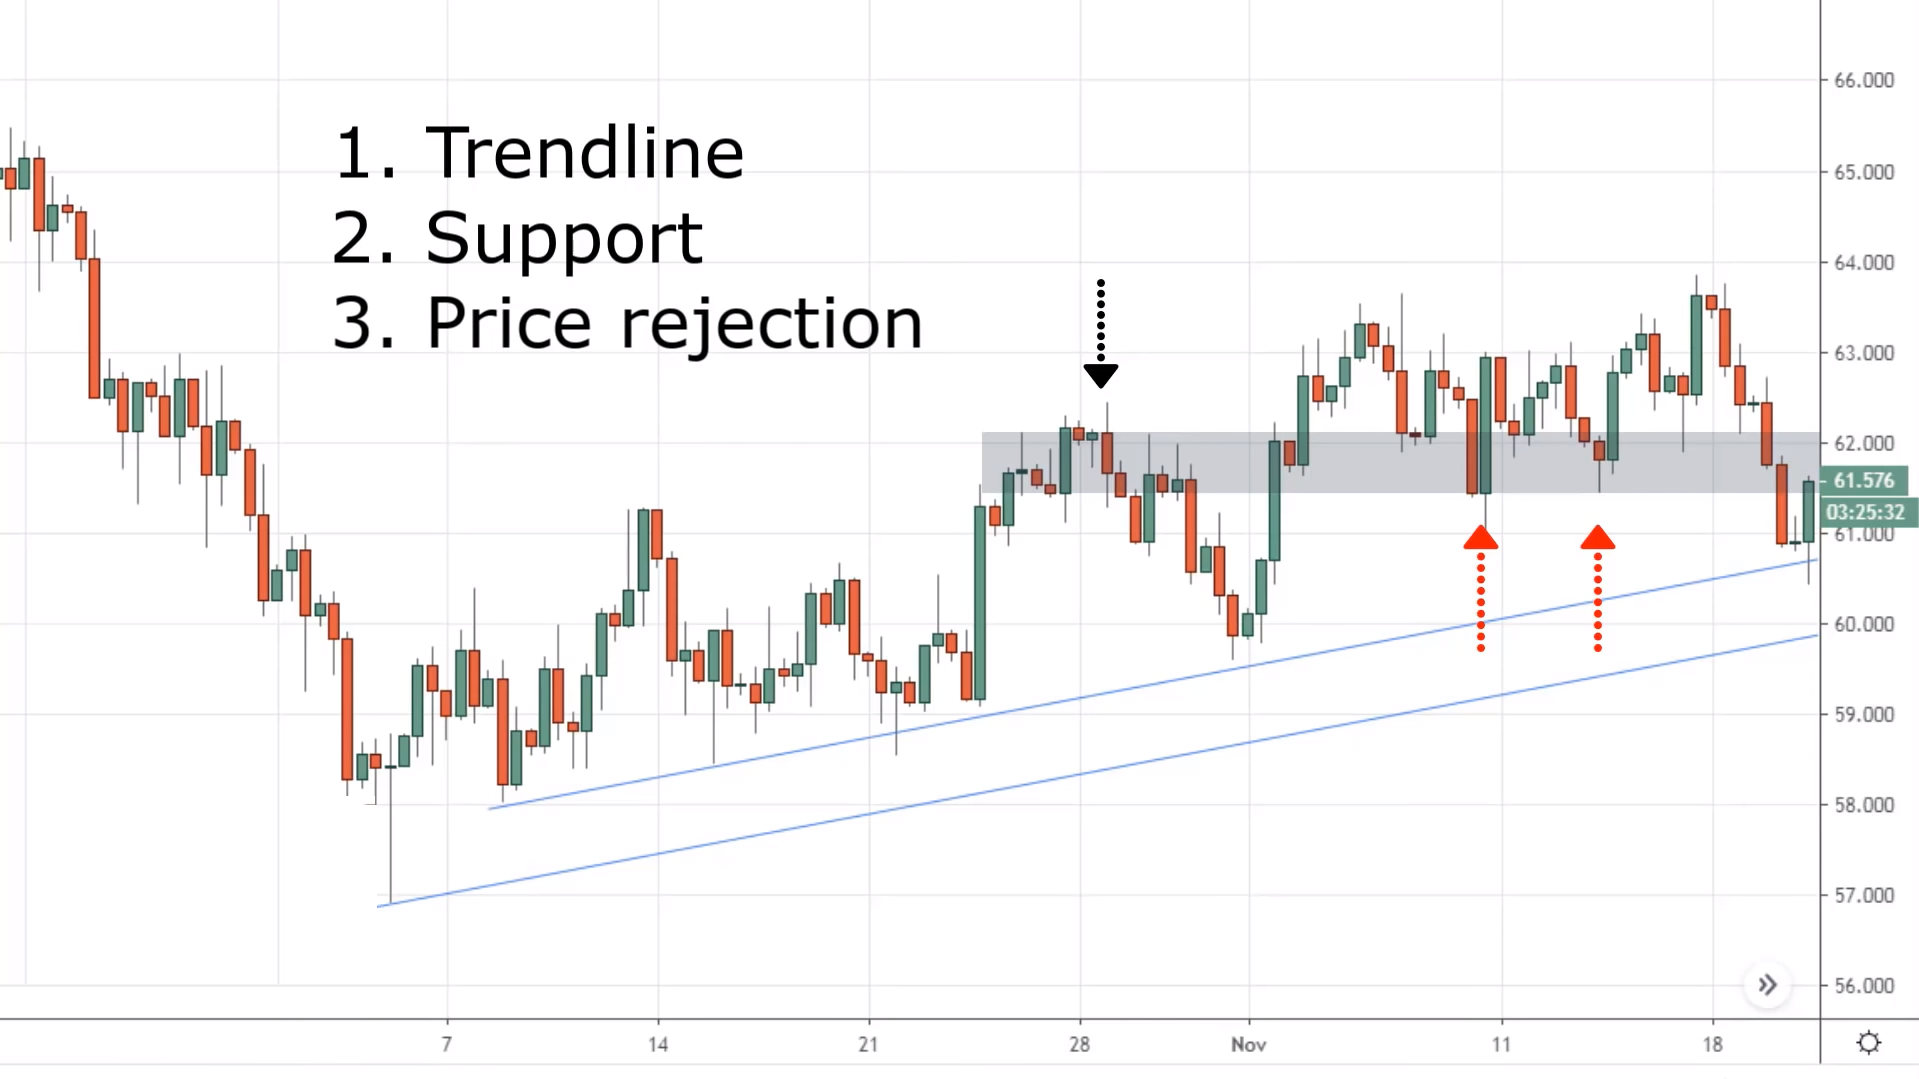
Now we can look forward. Let's see if there's a fourth bounce at this point. You have a price rejection. Note this over here. The price got rejected by this trend line.
Again, this is not a line on your chart, even though it's called a trend line. I wish I'd call it trend area.
Because if you're thinking about this, your trend line is an area in your chart and you just have no idea which part of the trend line you will reverse, whether it be the early portion of the trendline or the later portion.
So that's why you let the price be your guide. In this case, the market did give you a signal. You can see that strong selling pressure into this area of value the trend line.
If you know your simple support resistance, you can see that over here, this is an area of support. Previous resistance becomes support and it’s back down here into this area of support as well.
So you've got multiple confluence factor. It’s something I'm going to talk about later on.
I can see that you've got multiple factors coming together, Trend line, support, price, rejection. This is like in the form of a bullish engulfing pattern telling you that the buyers are stepping in.
These are numerous factors coming together signaling to you that you might want to consider buying in this market condition.
This is how you know you can use the trend line in your trading. Looking for that bounce, looking for the additional confluence factors to time your entry.
Some of you might be thinking;
‘’Rayner, right now I understand candlestick patterns’’
But sometimes the market will not give you a clear and obvious candlestick pattern, it might not form a shooting star, hammer, bullish engulfing pattern.
It might not be obvious to your eyes that there is price rejection.
How do you probably enter the market?
So this is what I want to cover right now.
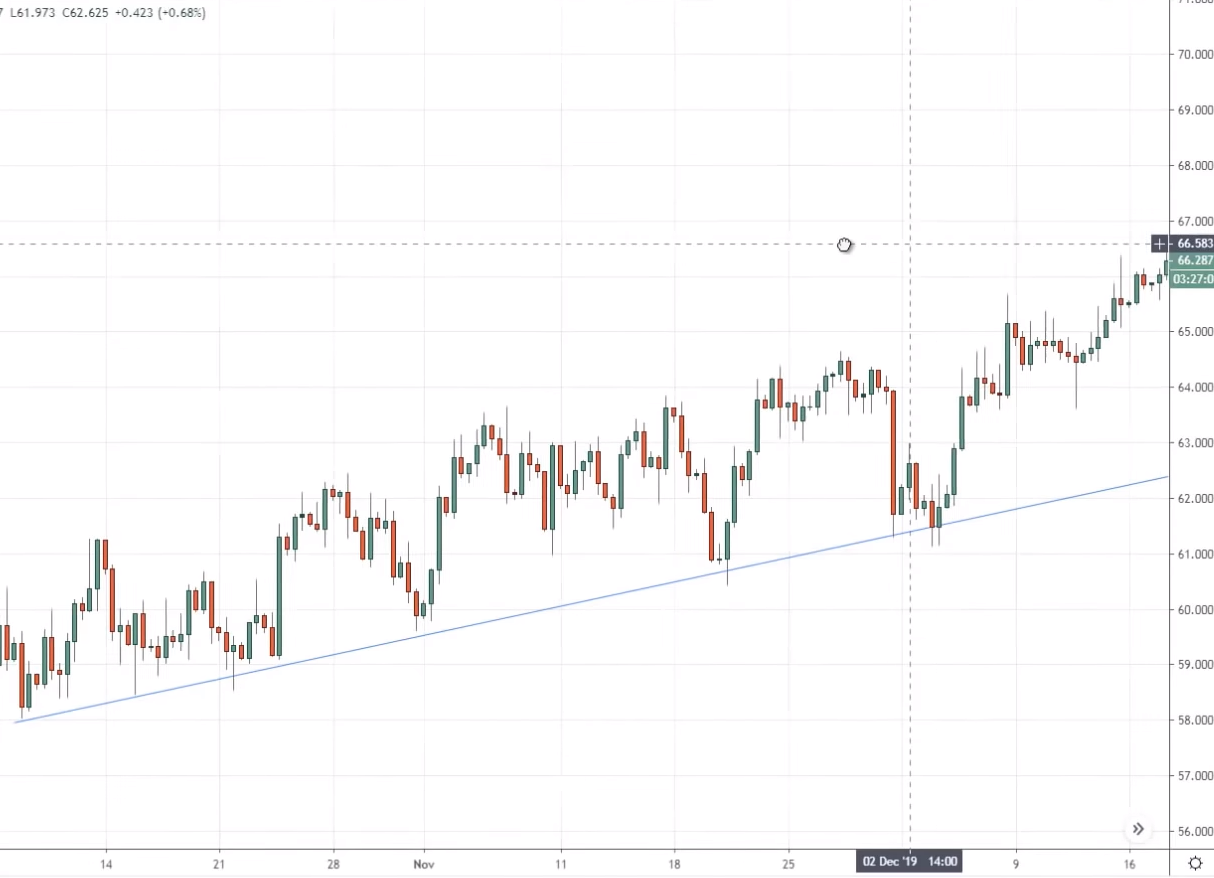
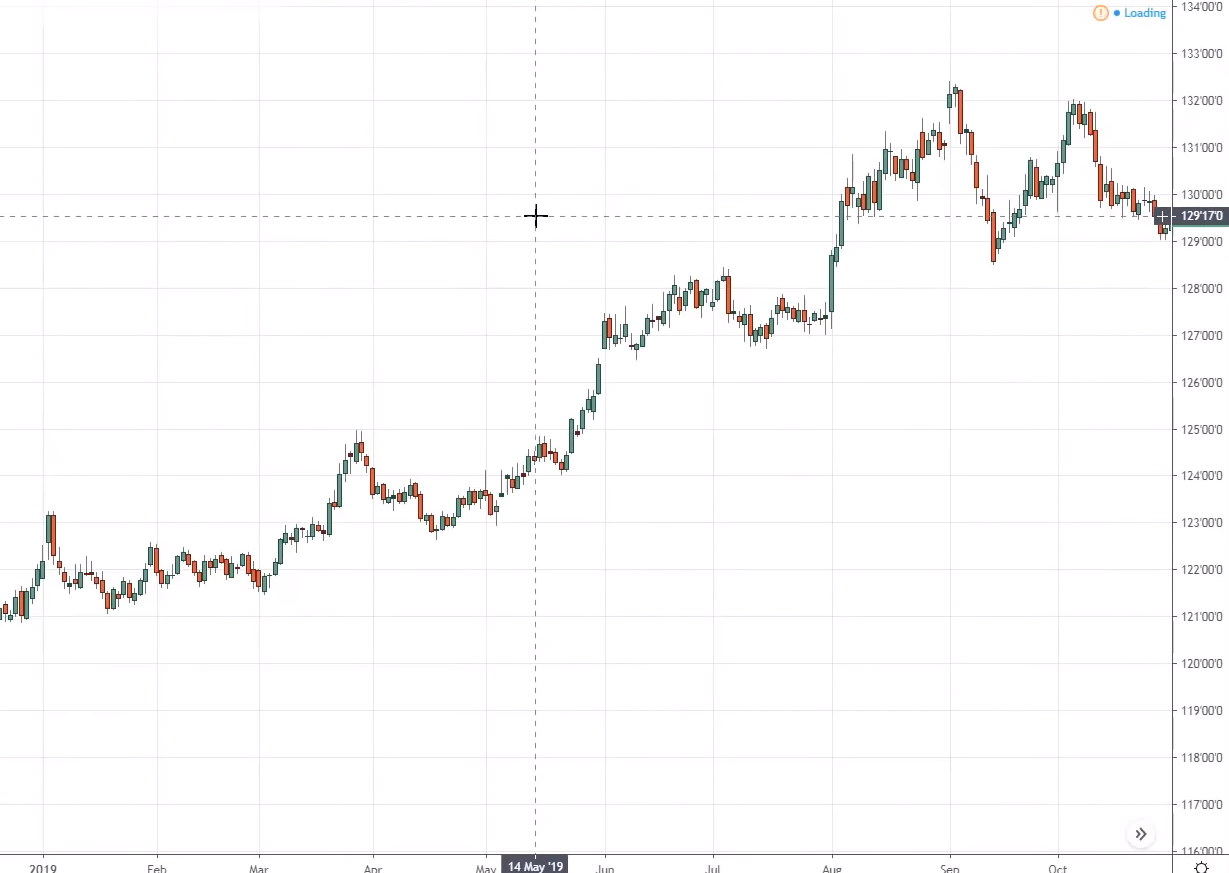
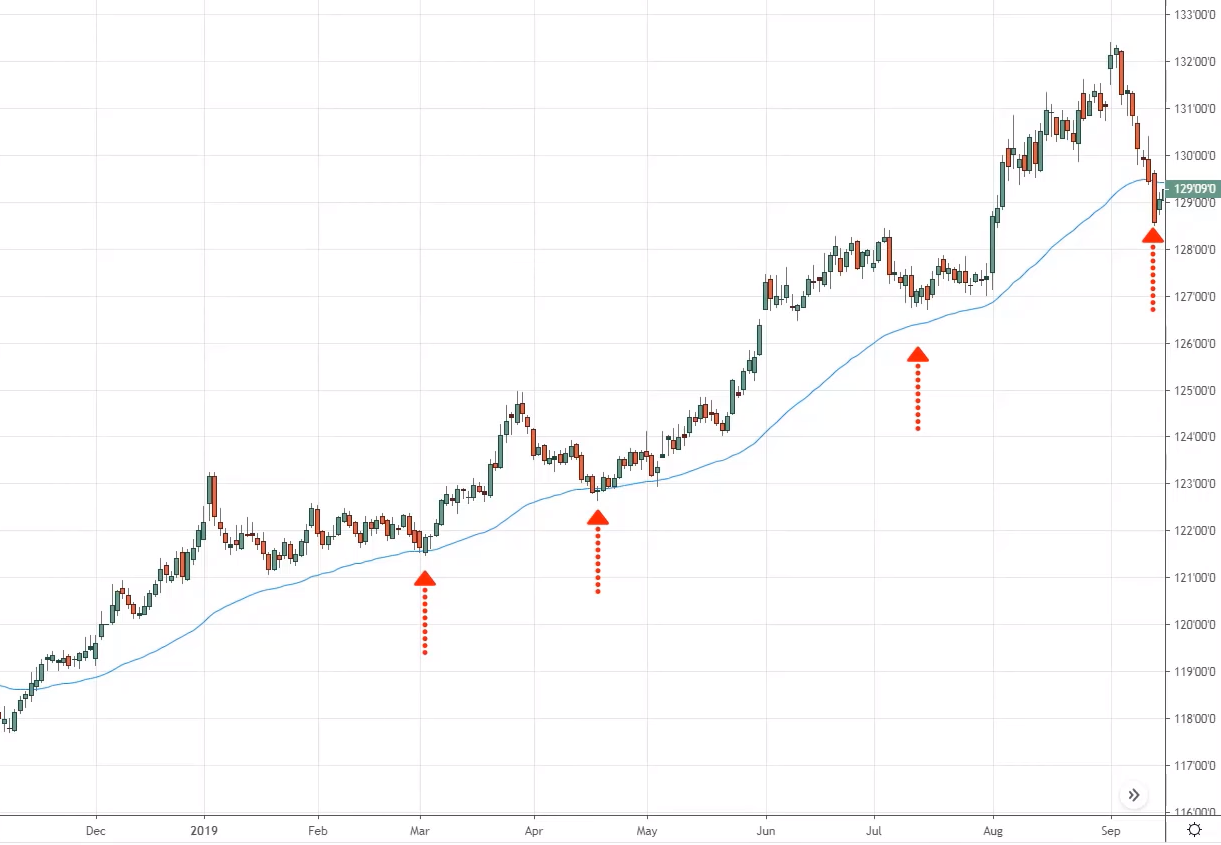
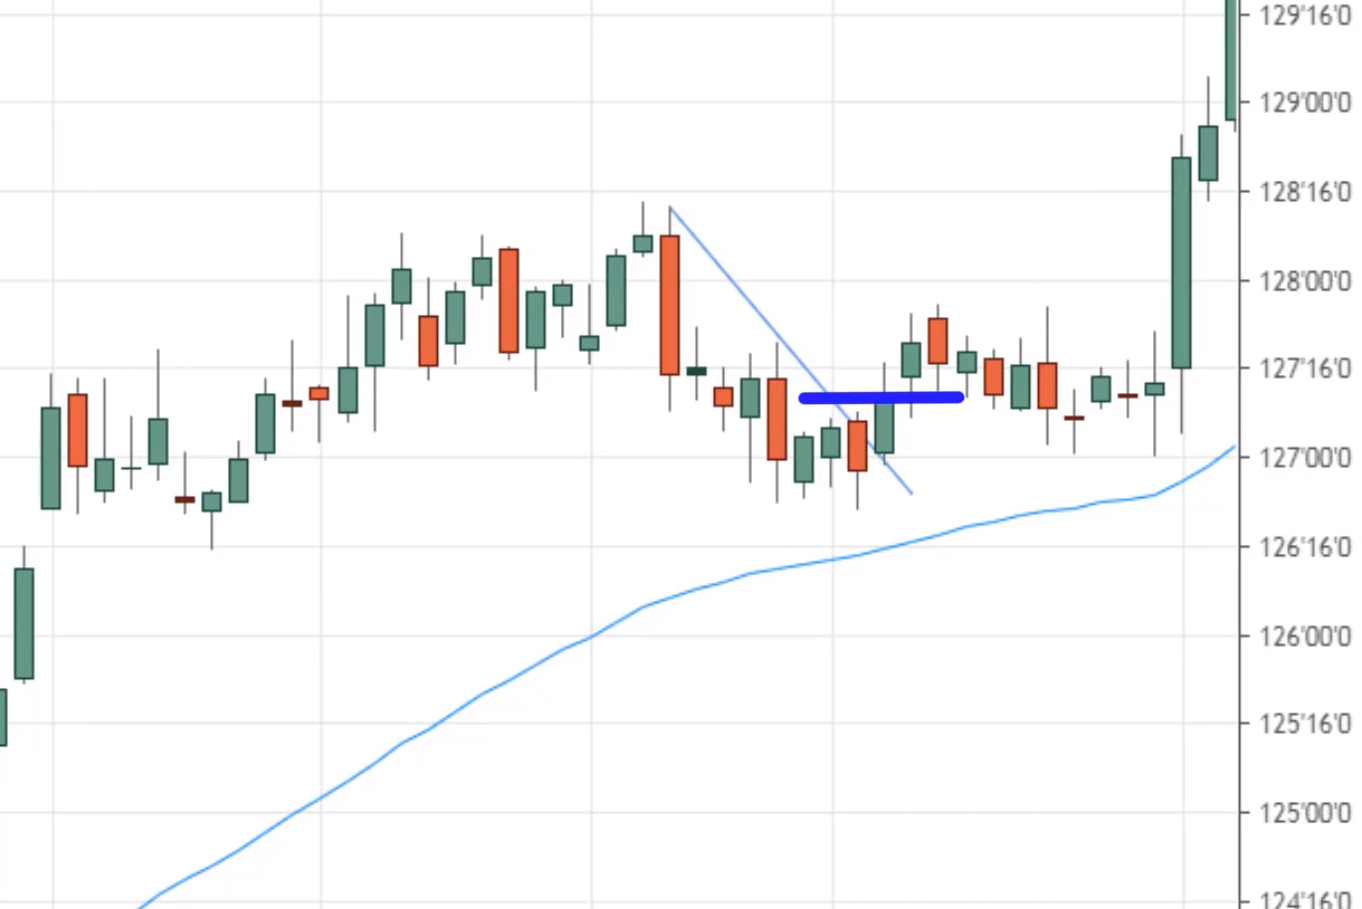
For example, this is the 10-year Treasury note futures. So you can see that over here. I just zoom out a little bit.
You can see that this market is in an uptrend. For this particular technique, I like to overlay the trend with the moving average that a market respects.
So this is a healthy trend, the market tends to find support at 50MA. So you can see over here that the market tends to find support at the 50MA...
The same concept as the trend line. You need a minimum of two tests before you can confirm the market is respecting this particular moving average. recall, I say this an area, it's not a line
In this case, the market didn't retest the 50MA before it continues higher. Now here's the tricky part.
You might be wondering,
‘’Hey Rayner, at this point I don't have any signal to enter the trade’’ right?
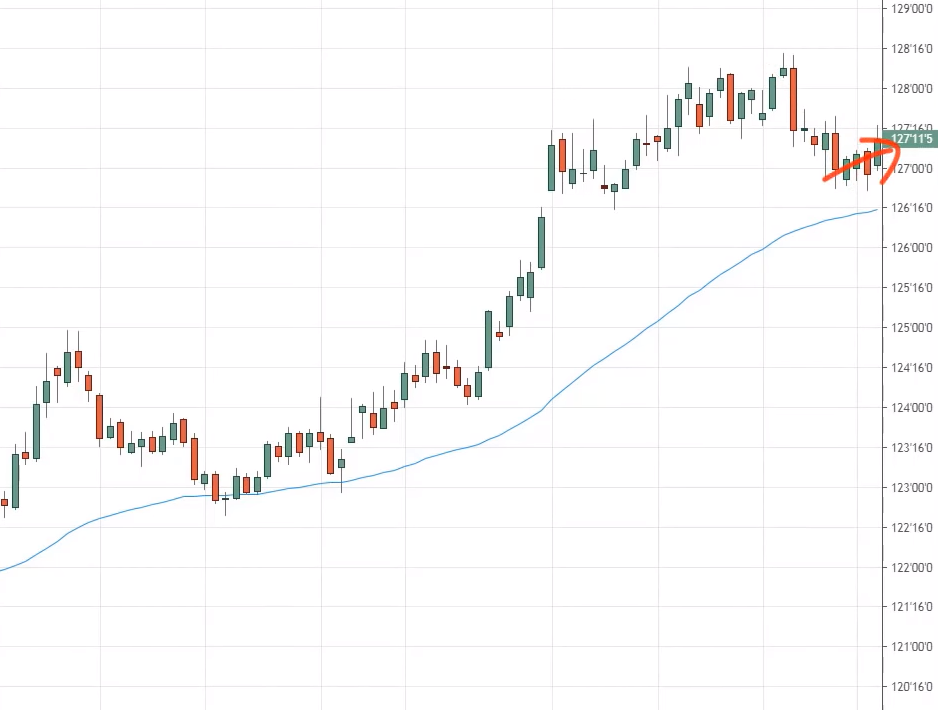
The market just came down lower over here, there is a small bullish candle. And then he starts to just reverse up higher from here.
There's no strong price rejection and there is no bullish engulfing pattern. There is no signal to enter the trade, So Rayner what now?
This is where the technique called the ‘’trend line break’’ comes into place.
What you're doing here in this instance is to use the trend line as an entry trigger to enter the trade.
For example, in the previous section, what we are discussing is that you are using a trend line to help you define your area of value.
And then time your entry using a price rejection, like reversal candlestick patents
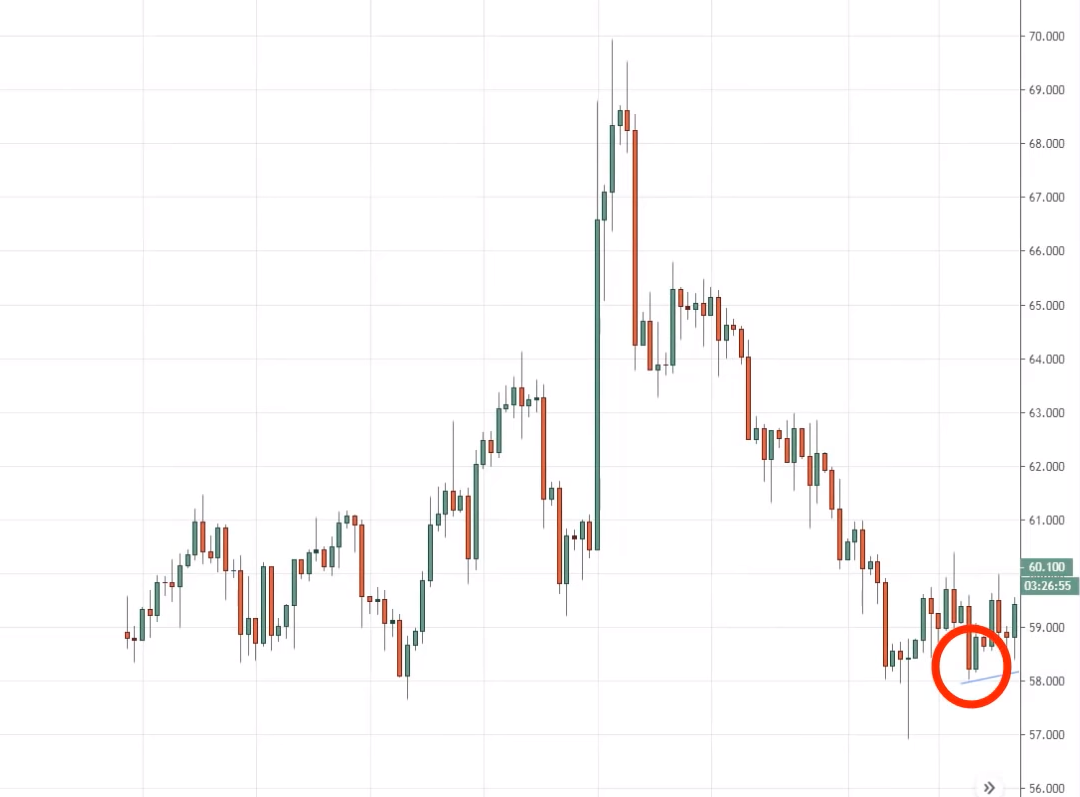
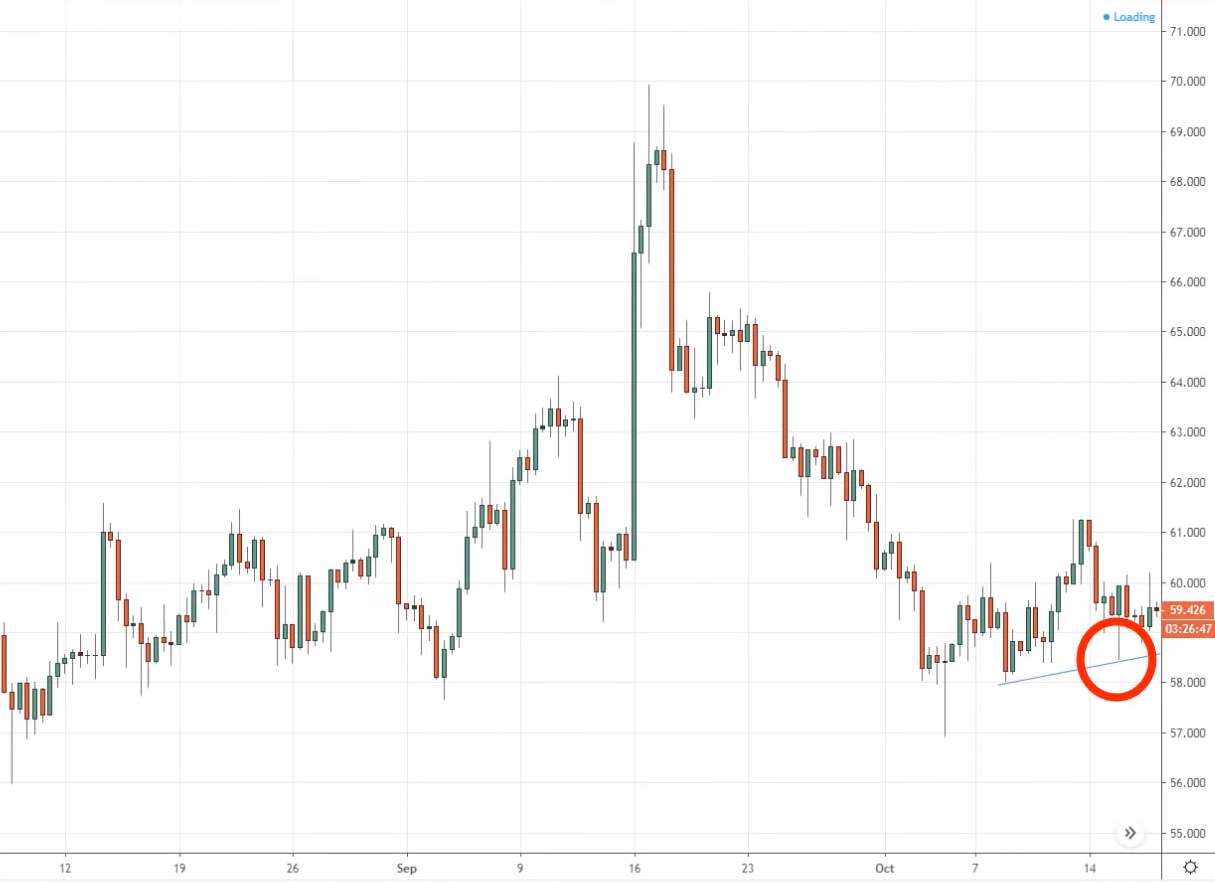
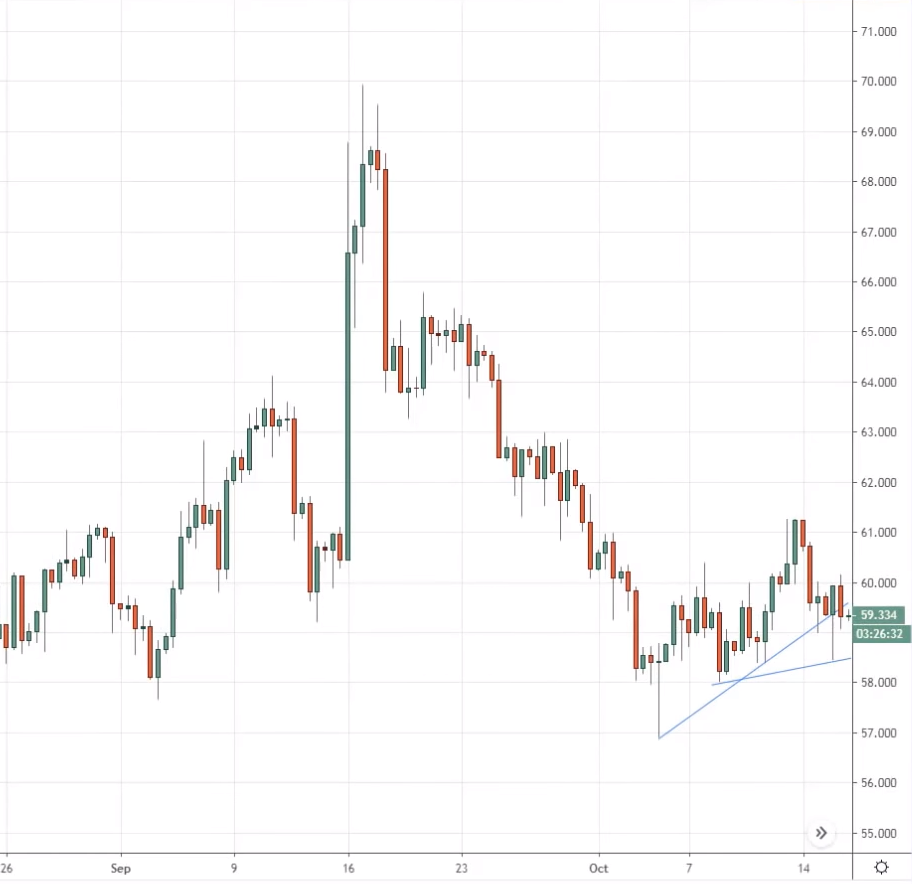
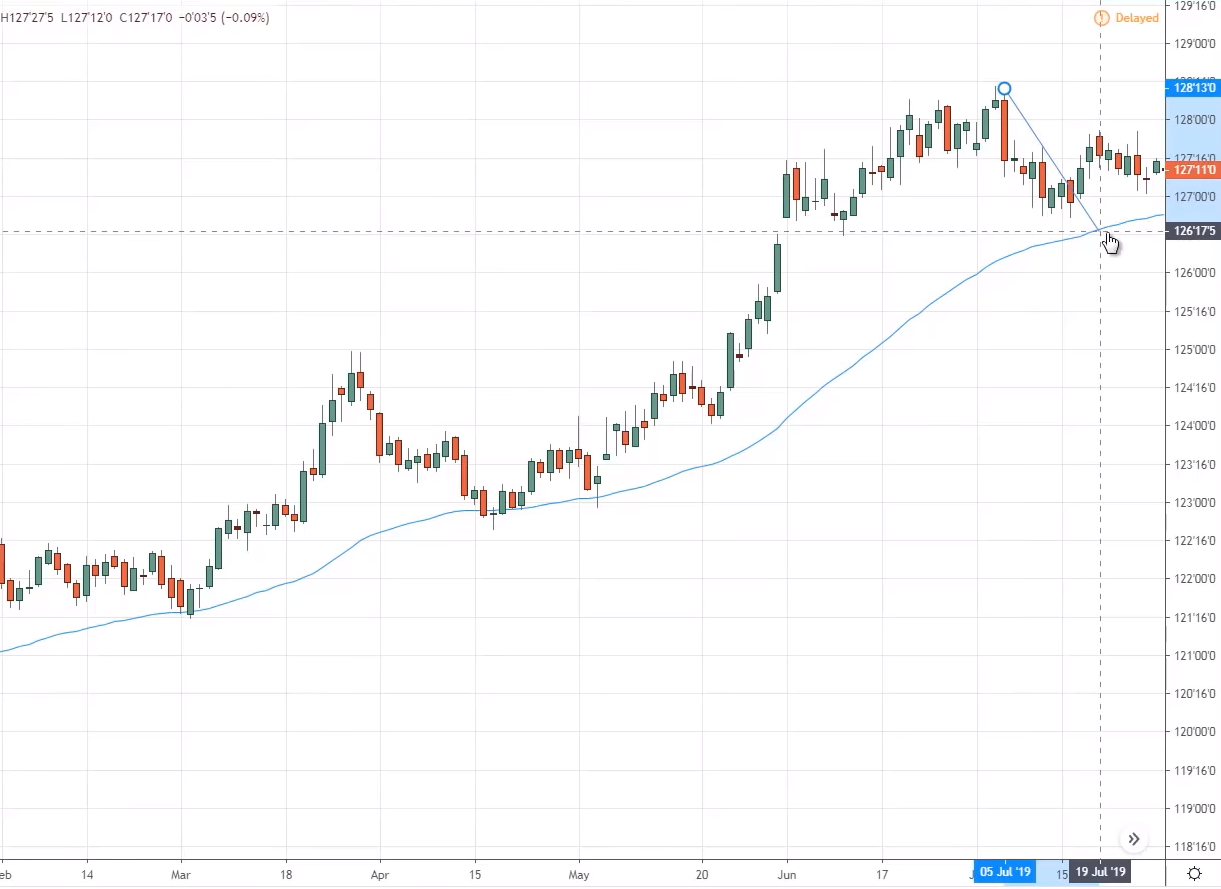
But right now what we are doing is that we are using the trend line to time your entry and how you go about doing it is that you want to draw the retracement trend line on a pullback.
So in this case, you can draw a mini-trend line connecting from this high to this high and you can just draw the trend line down.
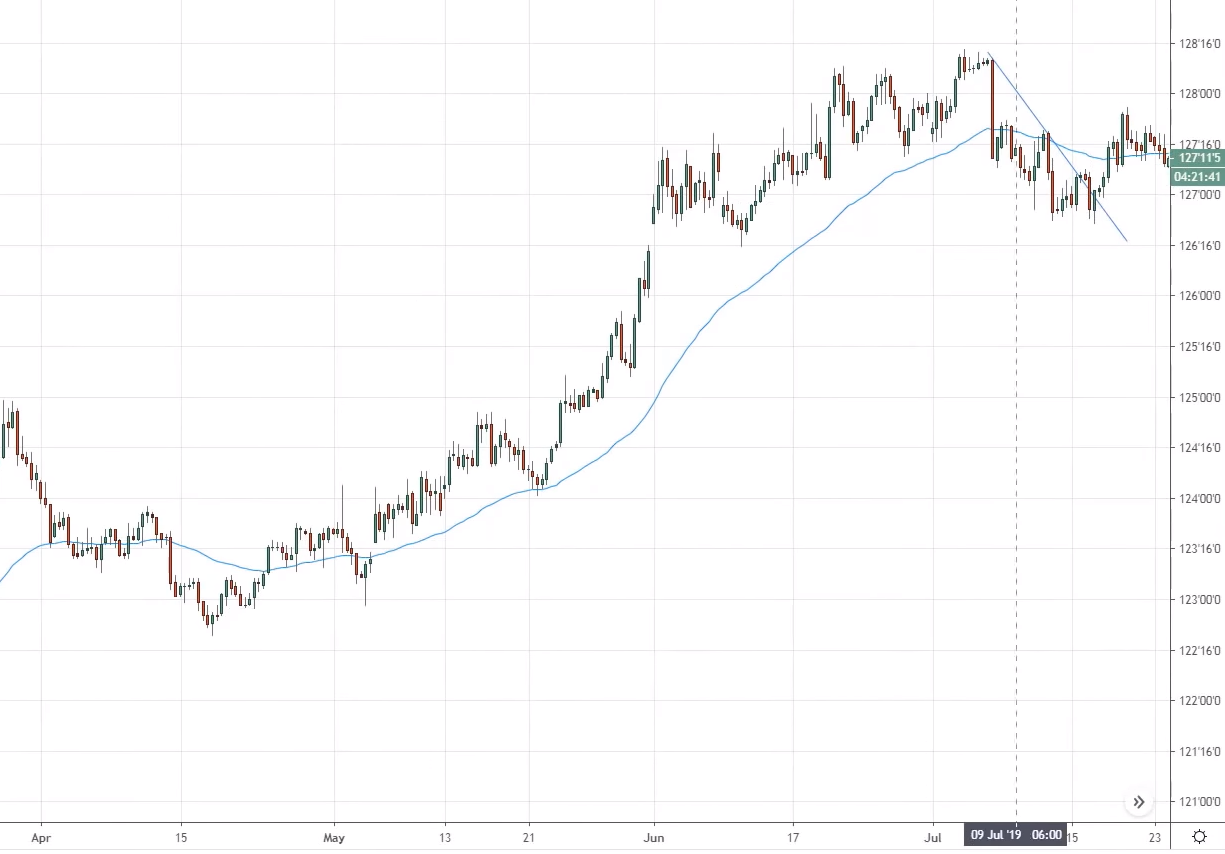
If you have difficulty, you can just go down to a lower timeframe
For example, the 8HR timeframe. You can see the market structure; it will be clearer to draw the trend line.
This is the same trend line over here, and you can adjust it better. This is how you draw the trend line on this eight-hour time frame.
The price section here is clearer and you might want to consider just going down one-time frame lower to draw the trend line.
Going back to the daily timeframe So what you'll do again is you can see the trend line that we have drawn earlier.
What you'll do is that you want to go long only when the price has broken and close above the trend line. So this is what I call a true the trendline break technique.
When the price break and close above the trend line, then you go long.
This is very useful especially if the market doesn't give you any reversal candlestick patterns. It doesn't show any form of price rejection.
This is a technique that you can use. The trendline break to help you time your entry into the market.
Moving on……
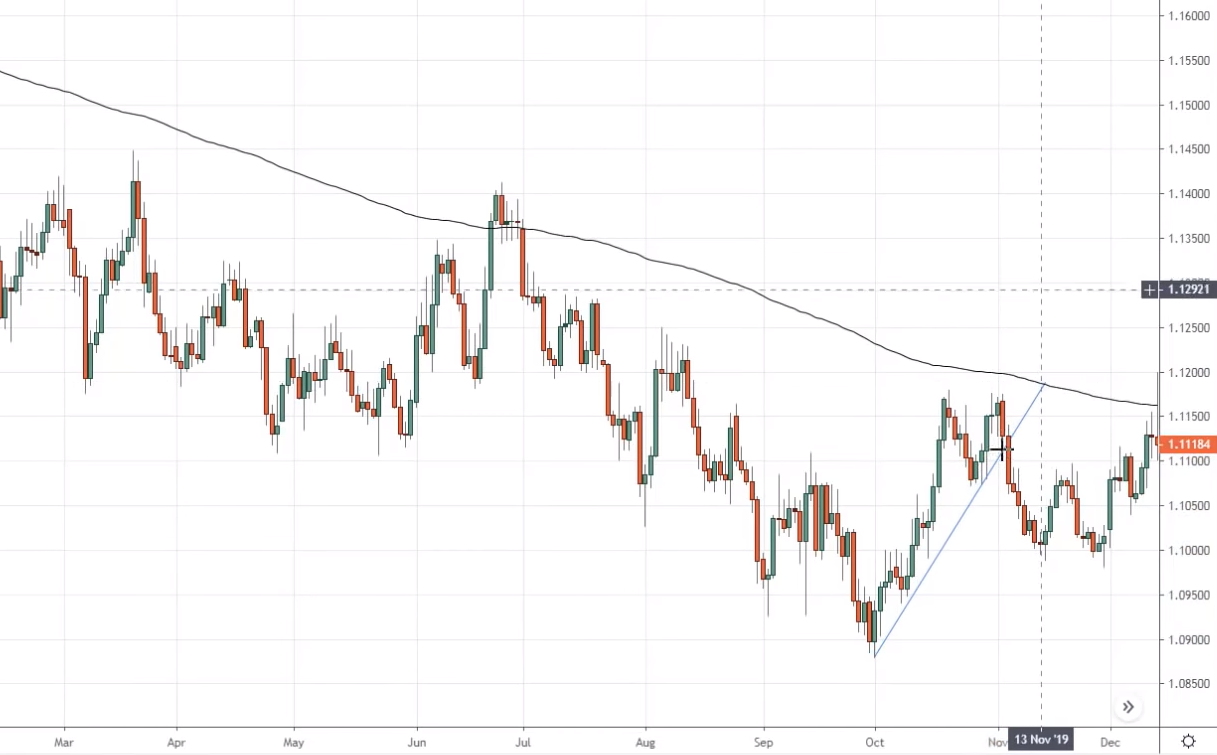
Example EURUSD.
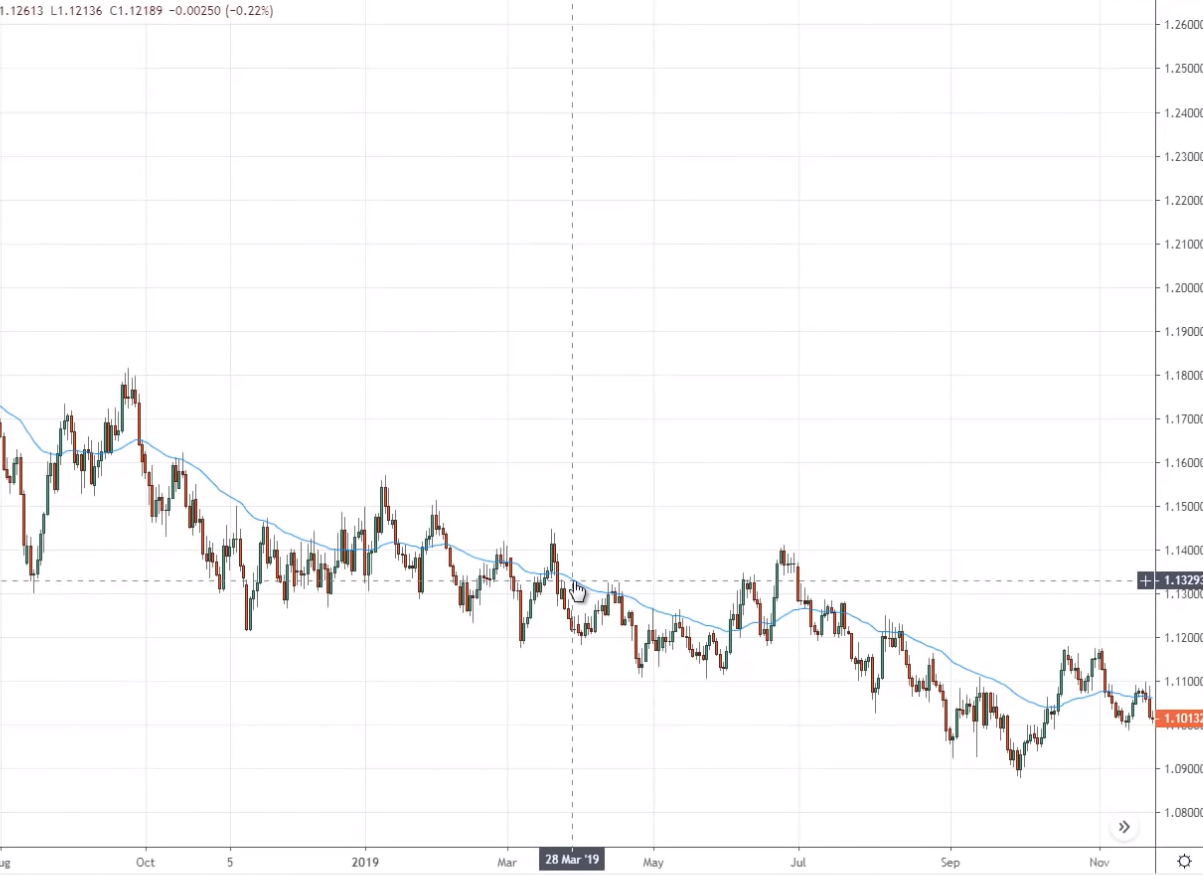
So in this case where you can see that if I zoom out the chart it doesn't seem to be respecting the 50EMA.
And the reason being is that this is not a healthy trend. This is more of a weak trend where the pullback is much deeper.
In this case, usually in the weak trend, the price tends to either respect the 100 or 200EMA.
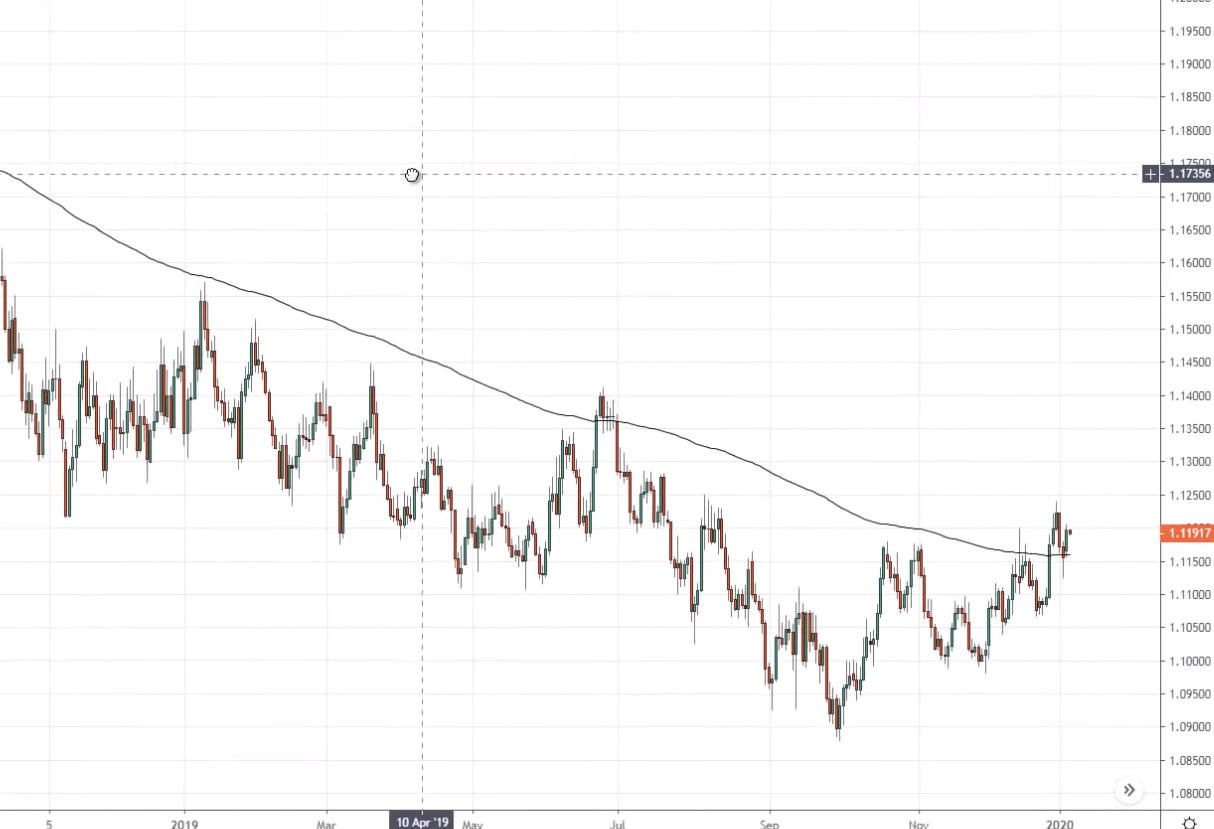
In this case its the 200EMA...
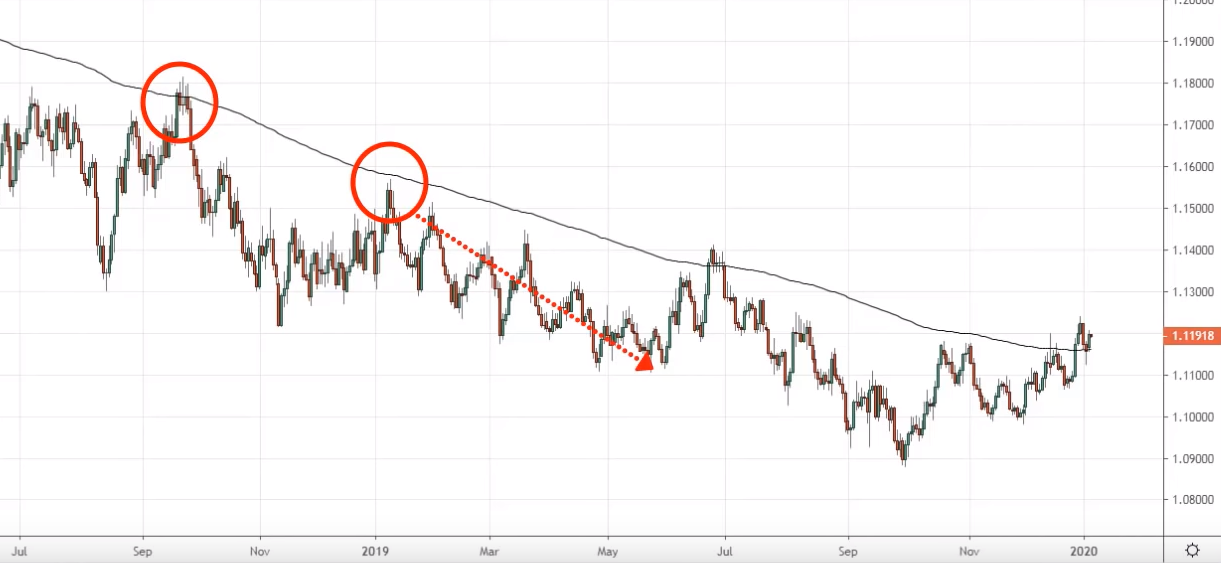
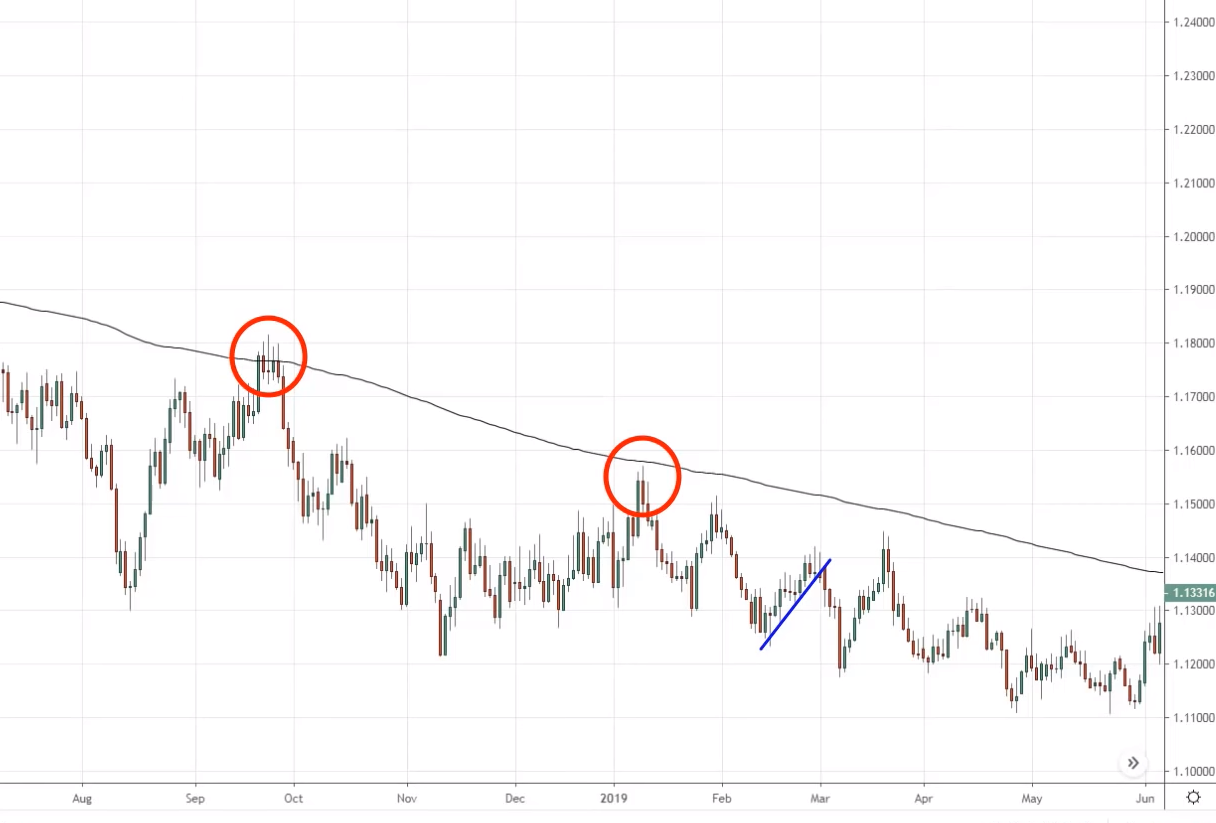
The same technique that you can use. You can use the trend line break effectively. And again, you need a minimum of two tests to decide whether the price respects the moving average or not.
So one test down below this swing low over, here we have a second test. Now we know, the market seems to be respecting this 200 period moving average.
At this point, the market came up over here that’s the fourth test.
How you can time your entry again, you don't have any form of price rejection.
What you can do is to use the trendline technique that I shared with you connected from the swing low up higher, and look for a trendline break.
So in this case, possibly this will be the entry trigger when the price breaks below this trend line.
This would be an entry trigger for you to go short.
When you trade this trendline break. You want to let the price come close to the moving average before you take the trade.
What do I mean by this?
For example, if you look at this point, you know that the market tested at ones and twice and it came back over here.
And this has a trend line break over here you can draw a trend line.
Let's be honest, you can draw a trend line over here and take this trade right towards the short side when the price breaks below this trend line.
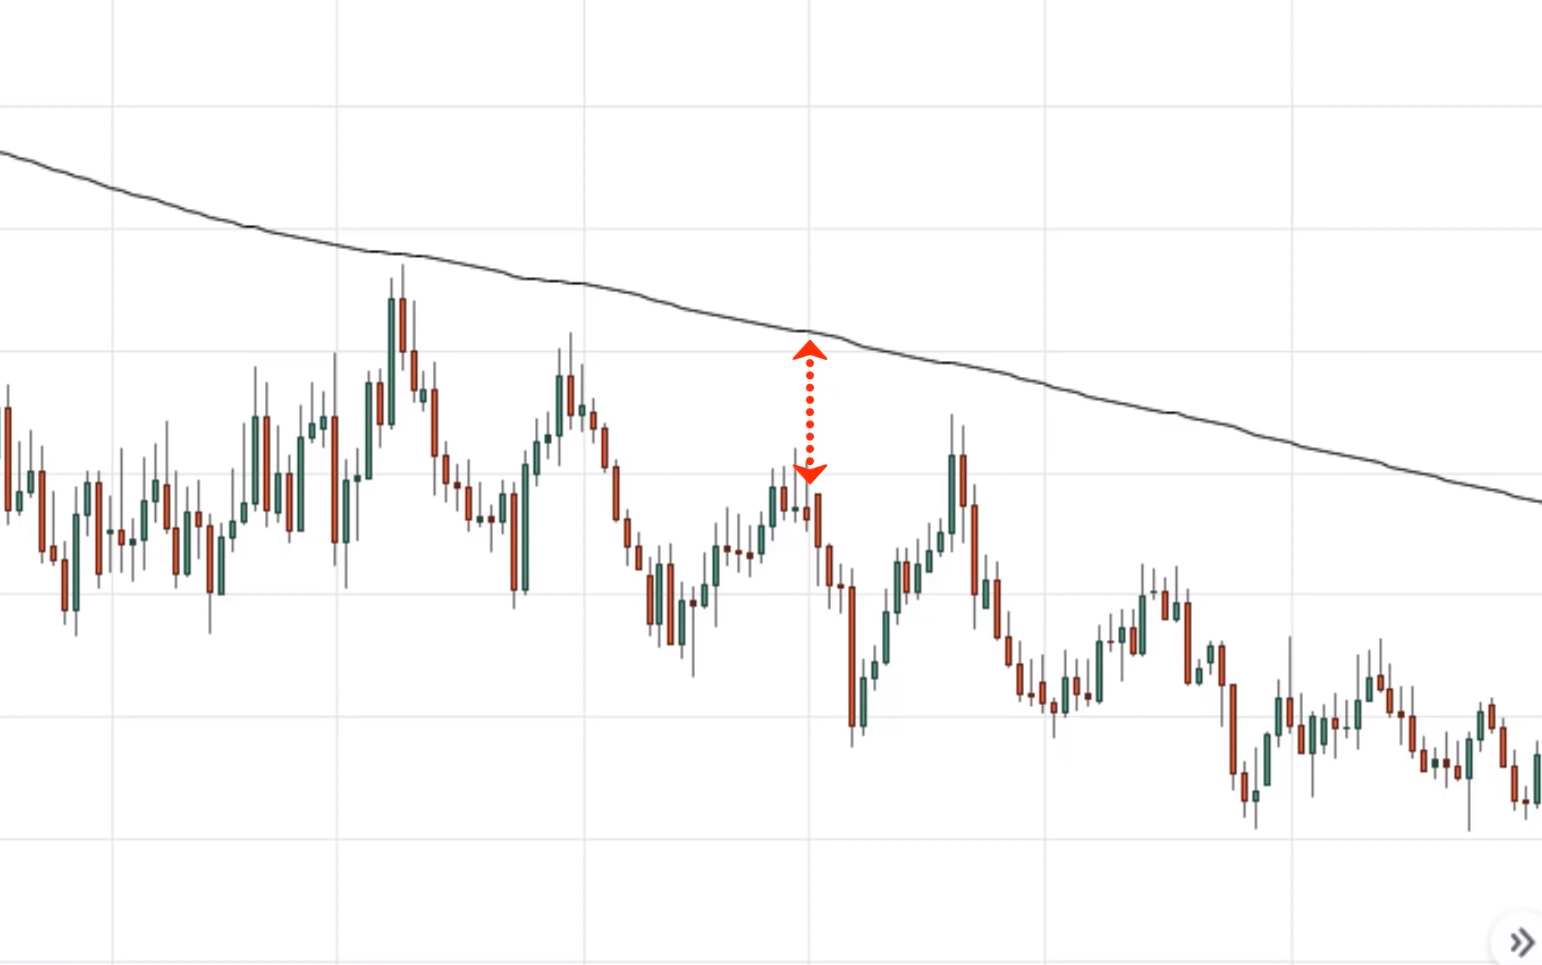
But I won't think it right, the reason is that it's still pretty far away from this area of value from the 200 periods moving average.
So if I were to set my stop loss, it won't be logical, If I were to set my stop loss above this high.
Because technically I’m cutting my trade into this area of value. So this is why I like to enter my trade as close as possible at the moving average.
So I can set my stop loss just slightly above the moving average. Where it's at a logical location.
So be aware, If the price is far away from the moving average and there is a trend line break, there is a trade that you might not want to take because if the market pulls back towards the moving average, you will get stopped up.
Hopefully, this our trendline break technique makes sense to you.
Moving on…
How to find higher probability Trendline setups
This is what we'll cover covering now. Earlier, we have discussed so far is that using trendline and price action to time your entries or using the trend line break to get you into a trade.
What are the tools that you can use to find higher probability trendline trading setups?
The same thing applies, when you draw a trend line, zoom out your charts.
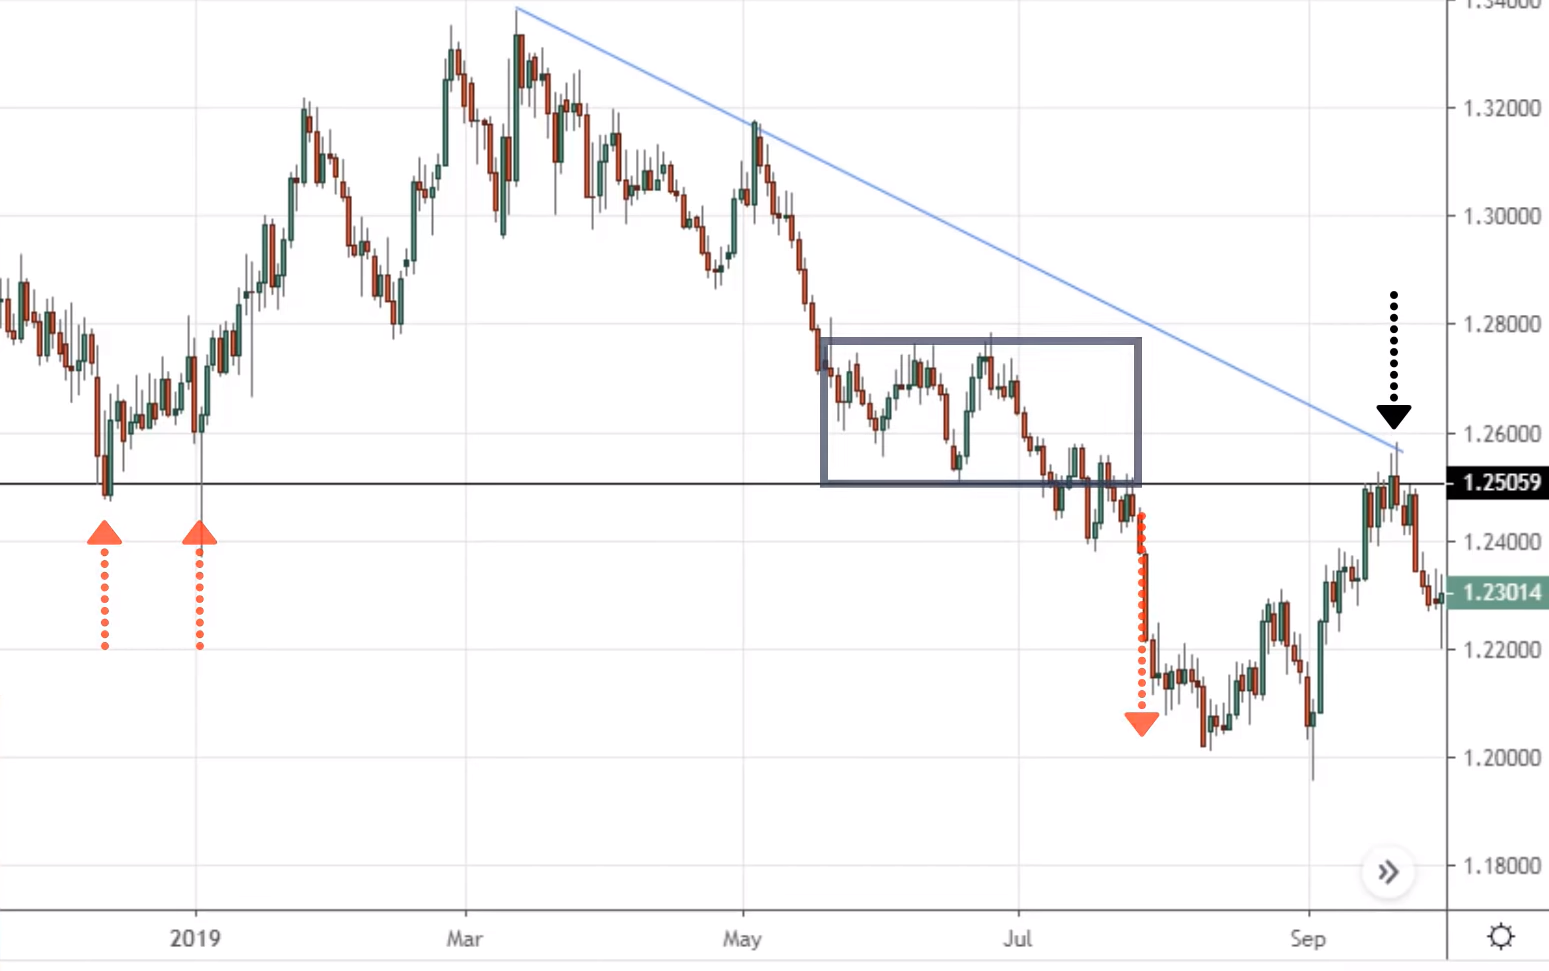
I will highlight you to this point over, so I'll just draw this level and you'll see why shortly this level is significant.
You can see that price bounce once or twice or, and this is the time the market came into this level on top of it. If you know simple support resistance, you can draw support resistance on your chart.
And if you ask me, I would say there is an area of support somewhere here.
Where price tested support once, twice, break down, and now tested previous support that could become resistance.
This is a key point over here, this is a key level on a chart, a key area in the chat.
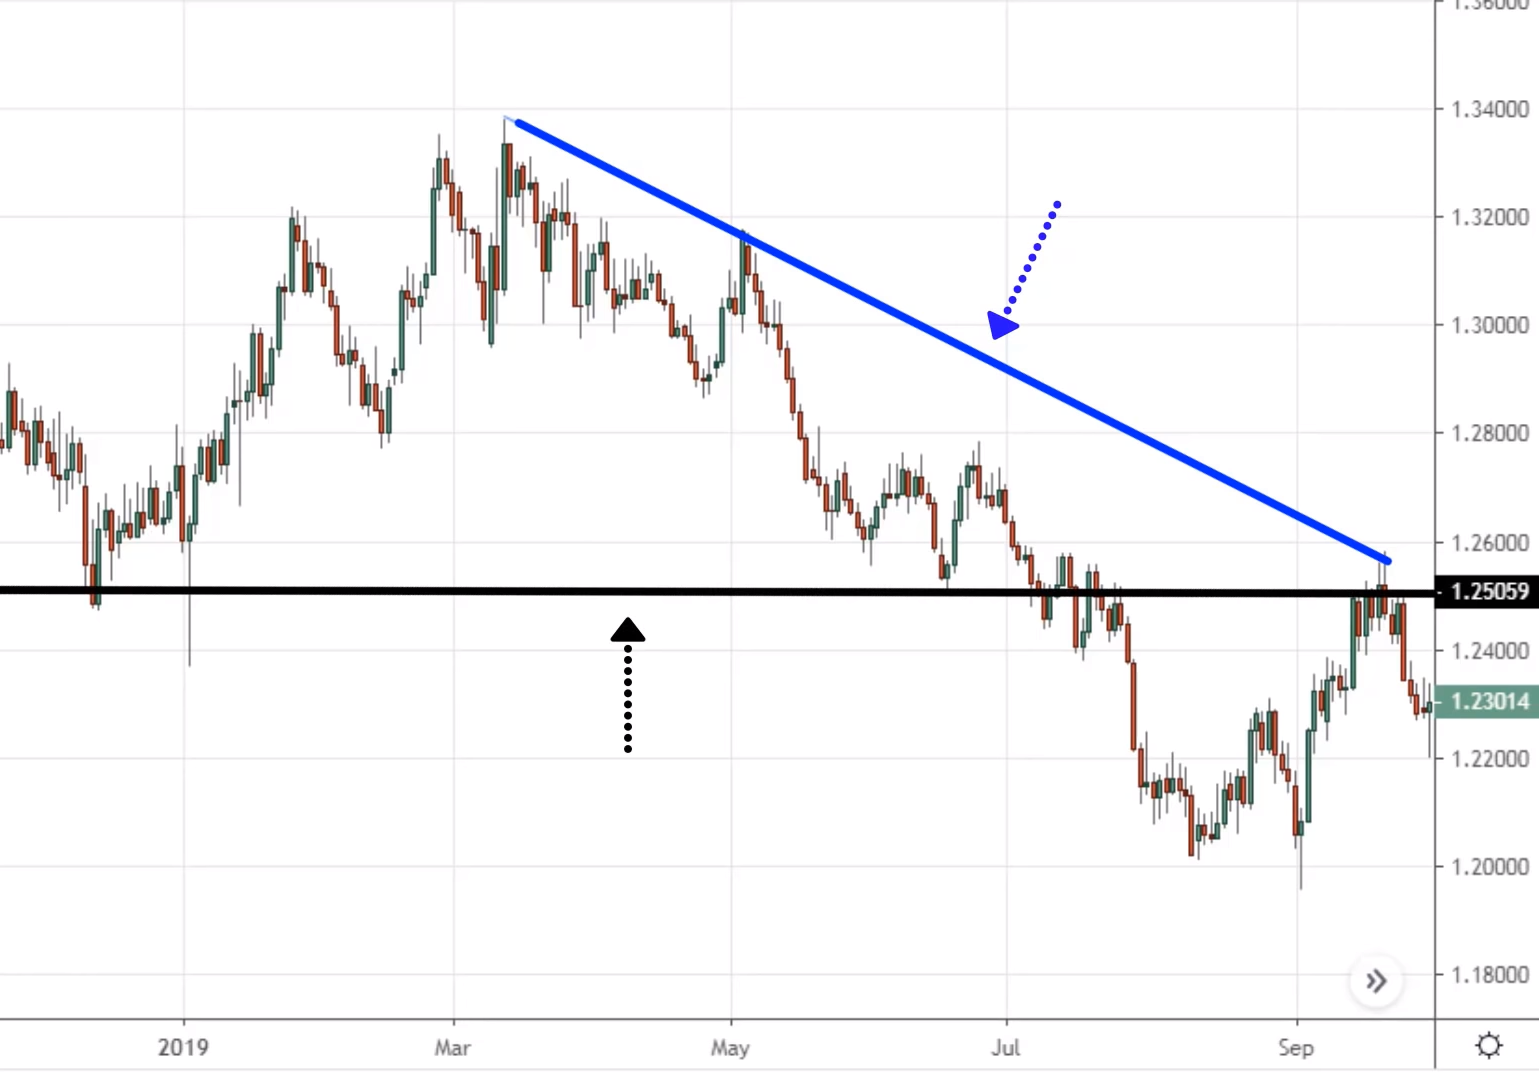
Why is that? Because you have multiple, technical confluence coming together...
- You've got this downward trend line
- You've got this area of support, where previous support could become resistance
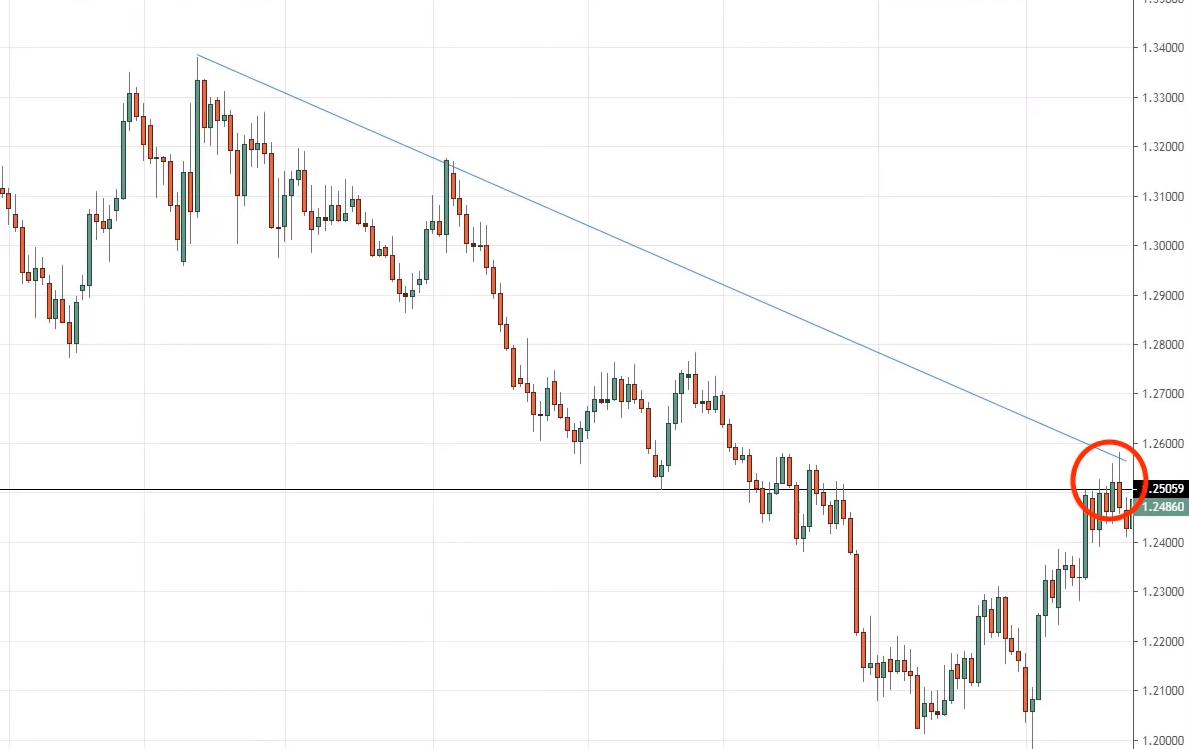
- You have price rejection
Look at this price rejection, multiple price rejection right here and even here at coming to this key area, after which the price breakdown.
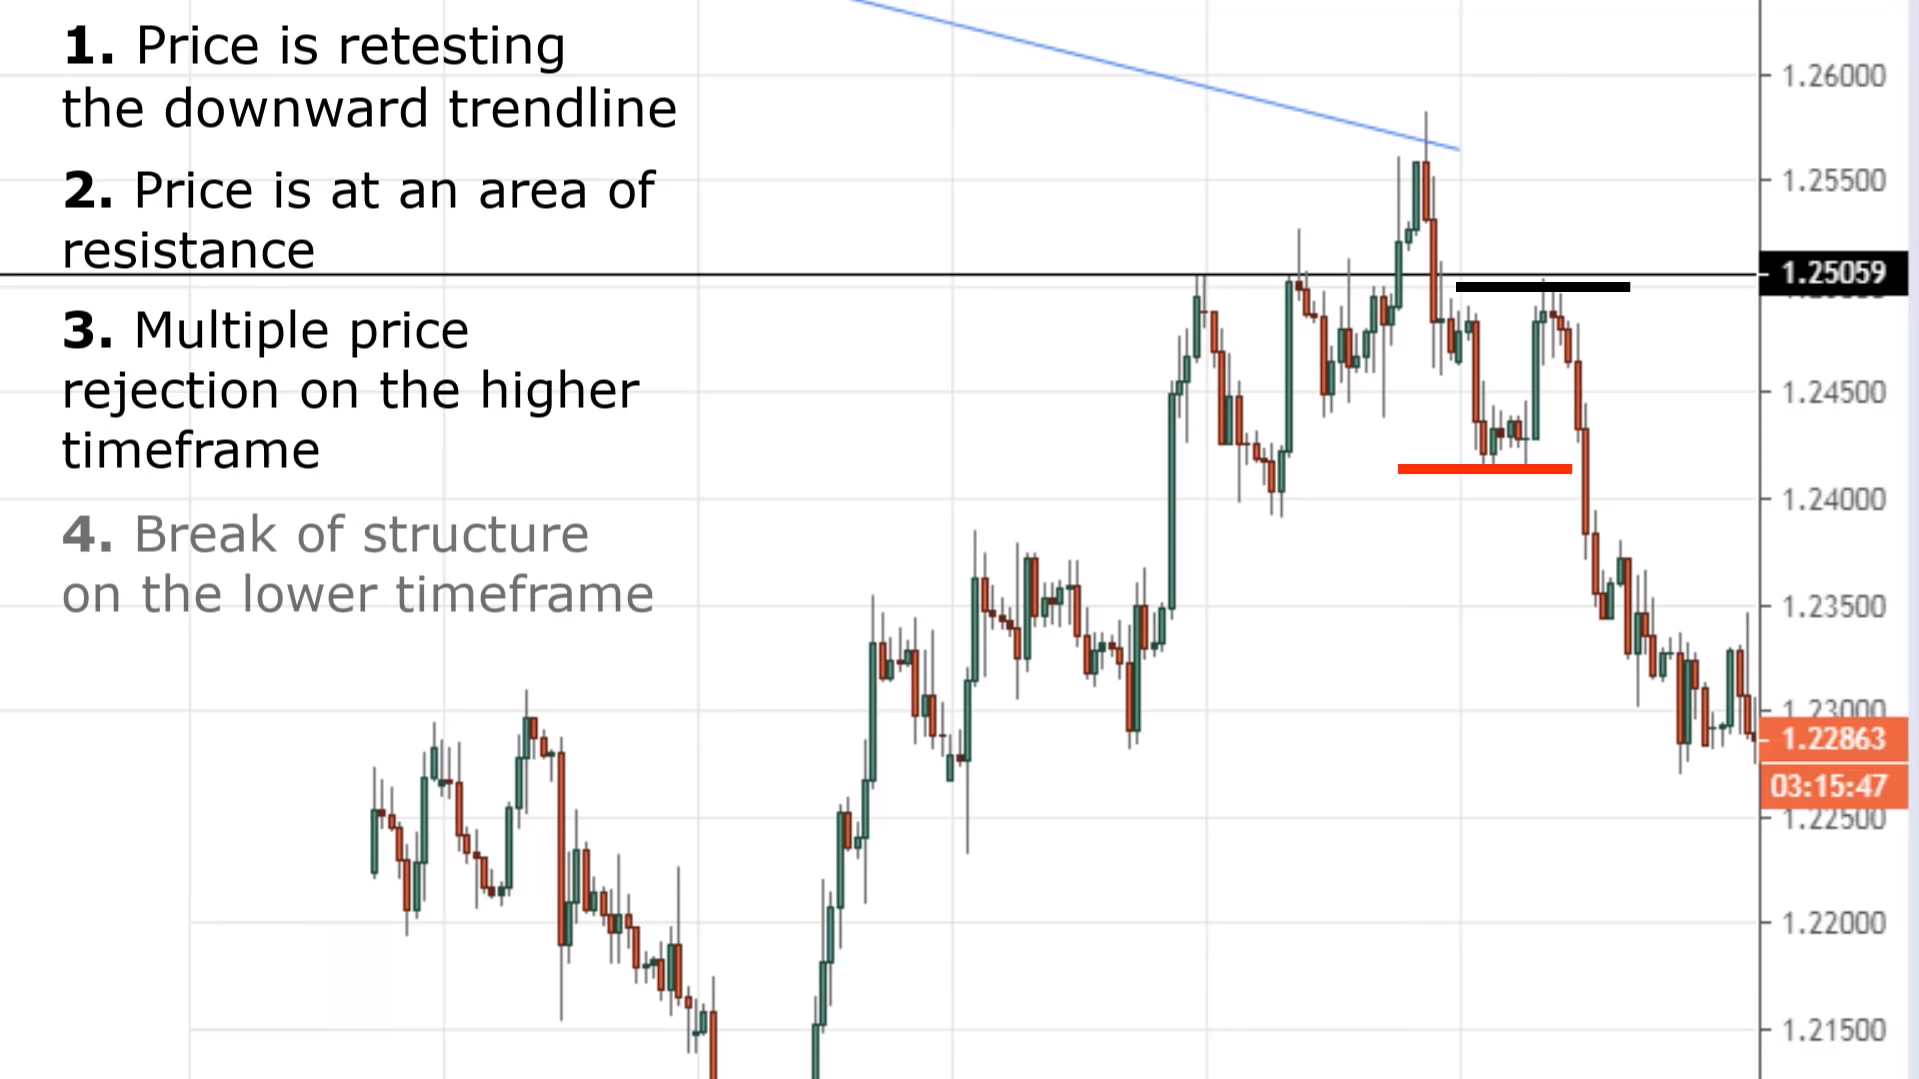
And finally, one last thing, if you look at a lower time frame, there is also a break of structure.
So let me explain what this means if you look at this portion over here on the lower timeframe
You can agree that it's going to be a series of higher high and higher lows because that's how the market makes a higher move.
Let me explain that to you, on a 4H timeframe, you'll see a series of higher highs and higher lows. So you can see that over here on the lower time frame you have this series of higher highs, higher lows, and higher highs.
So where the break of structure occur is at this point over here with a market made, a lower high, and lower low.
This is a break of structure you can see that they have multiple factors coming in, prices retesting that downward trend, area of value where it's an area of resistance.
Multiple price rejection on the higher time frame., a break of structure on this 4H time frame. It gives you that number of confluence coming together that makes this a higher probability trading setup.
Recap
- How to draw Trendlines
- Trendline Bounce: look for a strong price rejection to ‘’confirm’’ reversal
- Trendline Break: Look for a break of trendline if there’s no strong price rejection
- Improve your odds: Confluence of SR, break of structure

