#14: Do You Make These Support and Resistance Mistakes?
Lesson 14
Hey, Hey, what's up my friend? So let me ask you a question. Have you ever seen the price come into support and you think this is a strong level of support is going to hold?
So you buy
The next thing the price merge through support then you've got stopped out.
How about the price came into an area of support and it made a huge rally away from it, huge bullish move.
But the problem is you got stopped out of your trade before you can even take part in the big move.
So has any of those happened to you before? if it's a yes then today’s training is for you.
Because I'm going to share with you what are some of the most common mistakes traders makes when trading support and resistance and how you can avoid it.
But first, if you're watching this video for the first time, hit the thumbs up button and subscribe to my YouTube channel,
This way, whenever I publish a new training, you'll always be updated.
Let’s get started.
The first thing for us. The more times support is tested, the stronger it becomes.
‘’The more times it’s tested, the stronger it is’’
The Truth:
- More times it’s tested within a short period, the weaker it is
- Higher lows into resistance (sign if strength)
- Lower highs into support (a sign of weakness)
Have you heard of that scene before from textbooks or forums? You see stuff like the more time support is tested the stronger it becomes.
Well, that's not true.
The truth Is that the more time support gets tested, within a short period, the weaker it becomes.
Let me explain why.
So let me just give you an illustration.

So let's say this is an area of support and the price goes up, comes down, and you test it multiple times.
So we can see that support is an area where potential buying pressure would come in. Let’s say there is a certain limit order to buy at support, maybe from a hedge fund and institution.
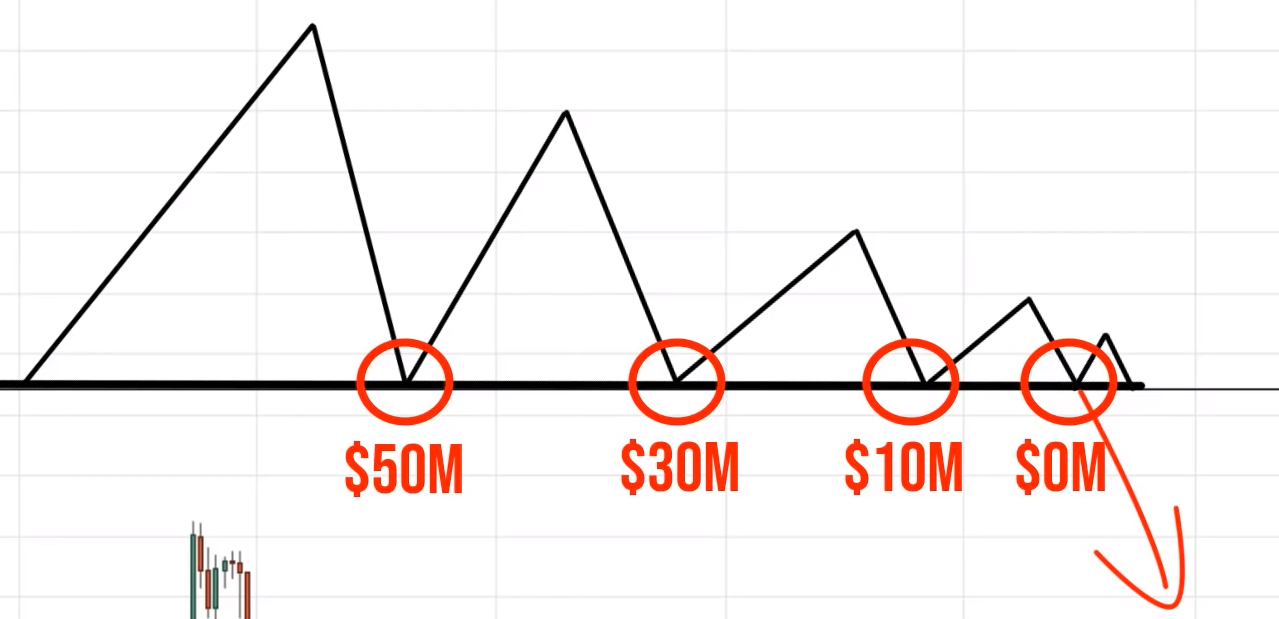
Let’s say it's worth up $100 million worth of buy orders.
The first time it comes up; it fills up 50 million.
Then rallies it comes back down and it fills up the remaining 30 million, rallies come back up, fill up 10 million, comes back down, fills up the remaining 10 million then eventually there is no one left to buying.
The price breaks down, so we can see that the more times price retest support within a short period.
The more of this buy limit orders get filled. Once all these buy orders get filled, who's left to buy me?
I don't want to be buying. So that's where you get right, the more times price retest support within a short period, the likelihood it will break down.
So this looks something like a descending triangle.
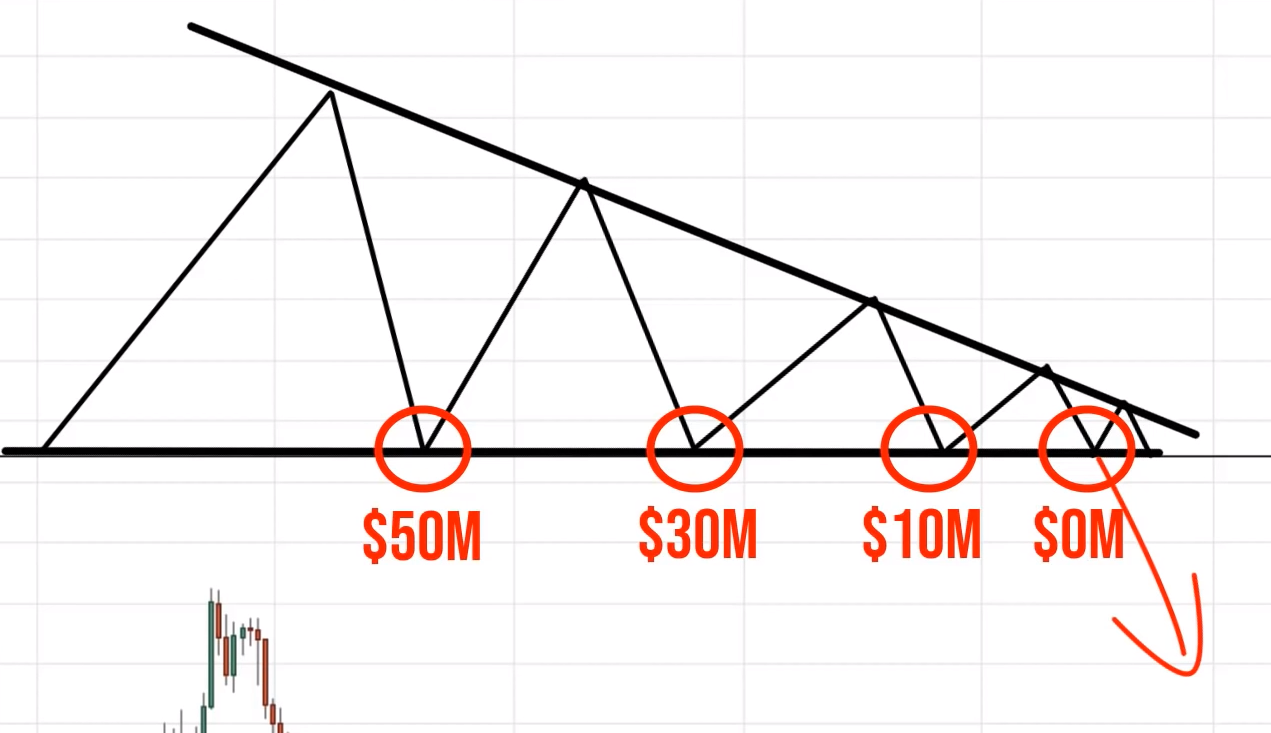
And the opposite is the ascending triangle.
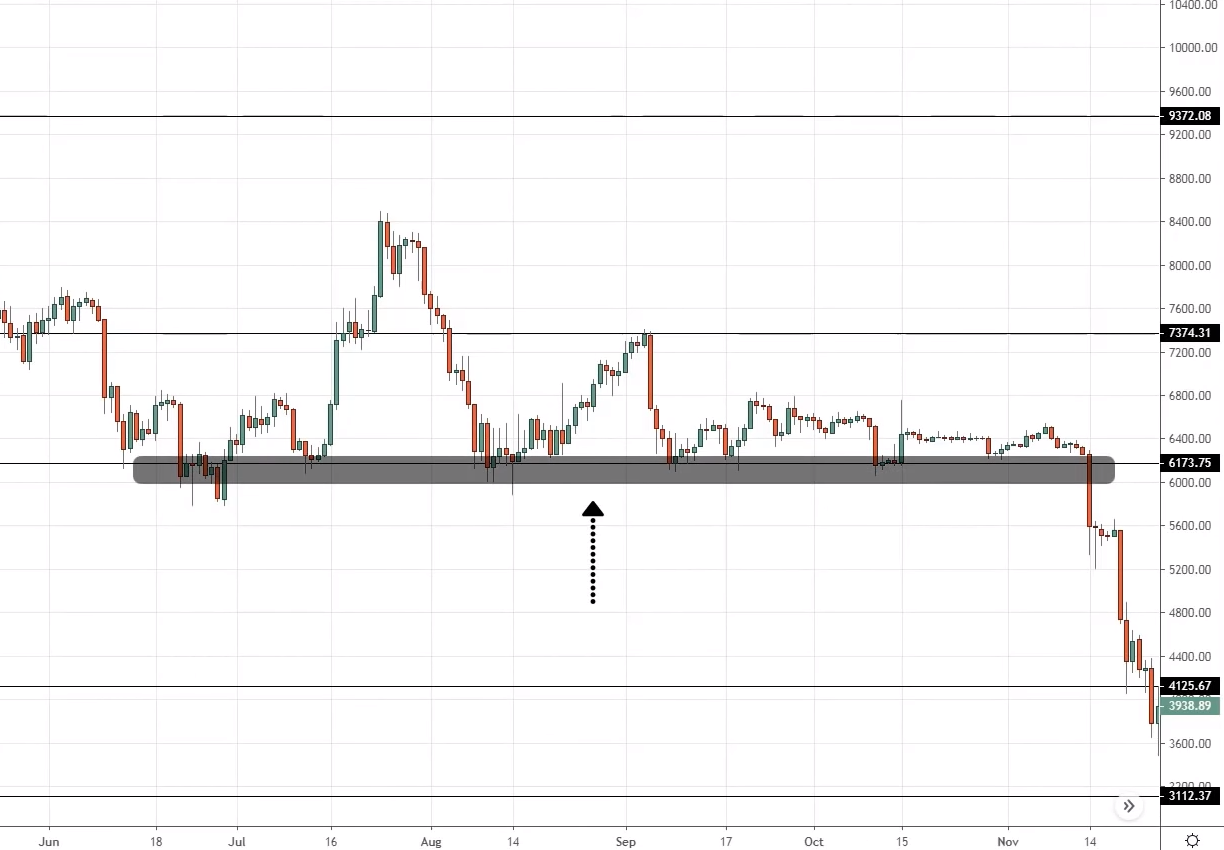
Let me just share with you an example, so over here you can see Bitcoin that illustrate these concepts pretty well.
So you can see that there is support around the 6,000 level. Price came into support rarely once came back down a couple of times and it breaks down.
So just by looking at this price action. You know that this market is getting weak.
You just look at the so-called swing of the rally right the first time is pretty strong, a big bullish candle, second time still strong, but not quite as strong as the first time.
And the fourth time is really weak. All the small range of candles.
So this is a sign to you that the buyers have difficulty pushing the price up higher. And this to me is a sign of weakness, not a sign of strength.
So whenever you see the more time support is being tested within a short period. That's a sign of weakness.
Moving on…
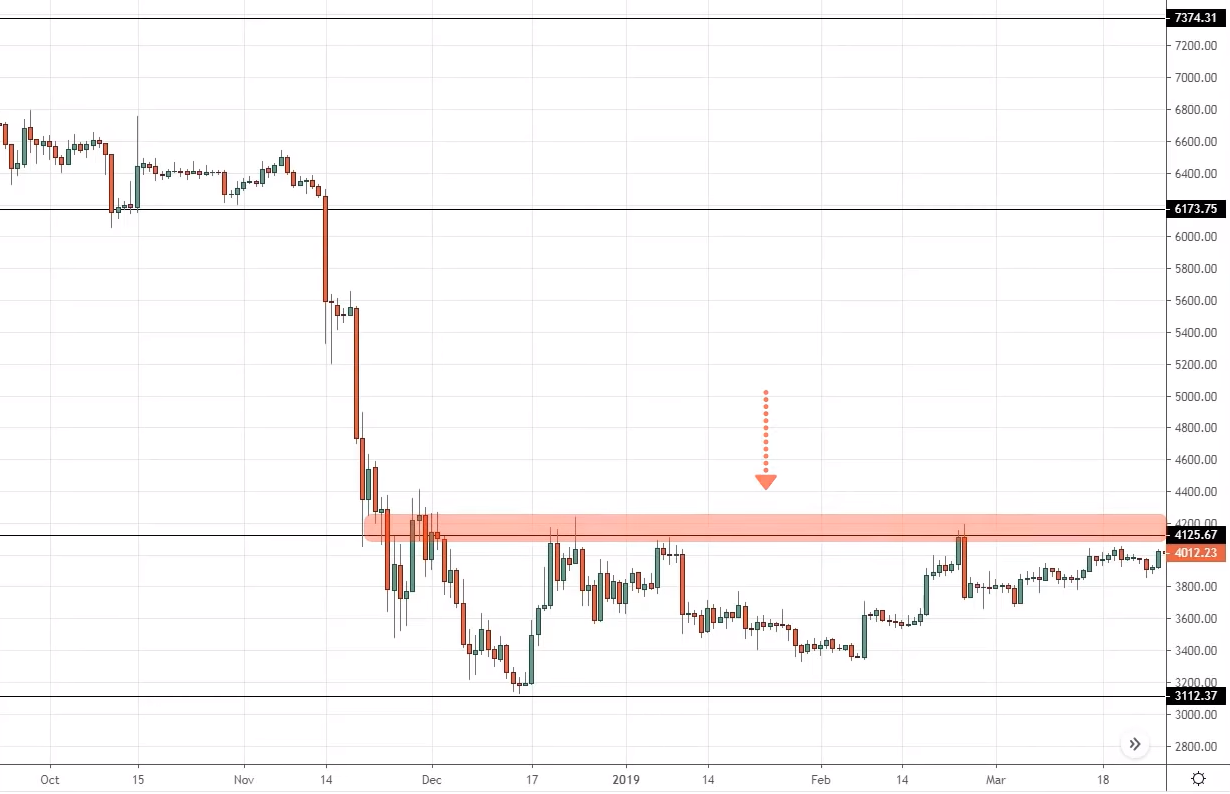
You can see another example over here:
This is the opposite, you can see that over here, this is resistance, price approach resistance, sold off approach resistance several times and then sold off a little bit.
So now you have a series of higher lows into resistance.
So is this a sign of strength or weakness?
This is a sign of strain. It shows you the buyers are willing to buy at these higher prices and the sellers have difficulty pushing the price lower.
The sellers push the price pretty strongly towards the downside here as well. Then after which the subsequent selling pressure from the sellers got weaker and weaker.
To me, it’s a sign of strength from the buyers they are willing to buy at these higher prices that would lead to a breakup.
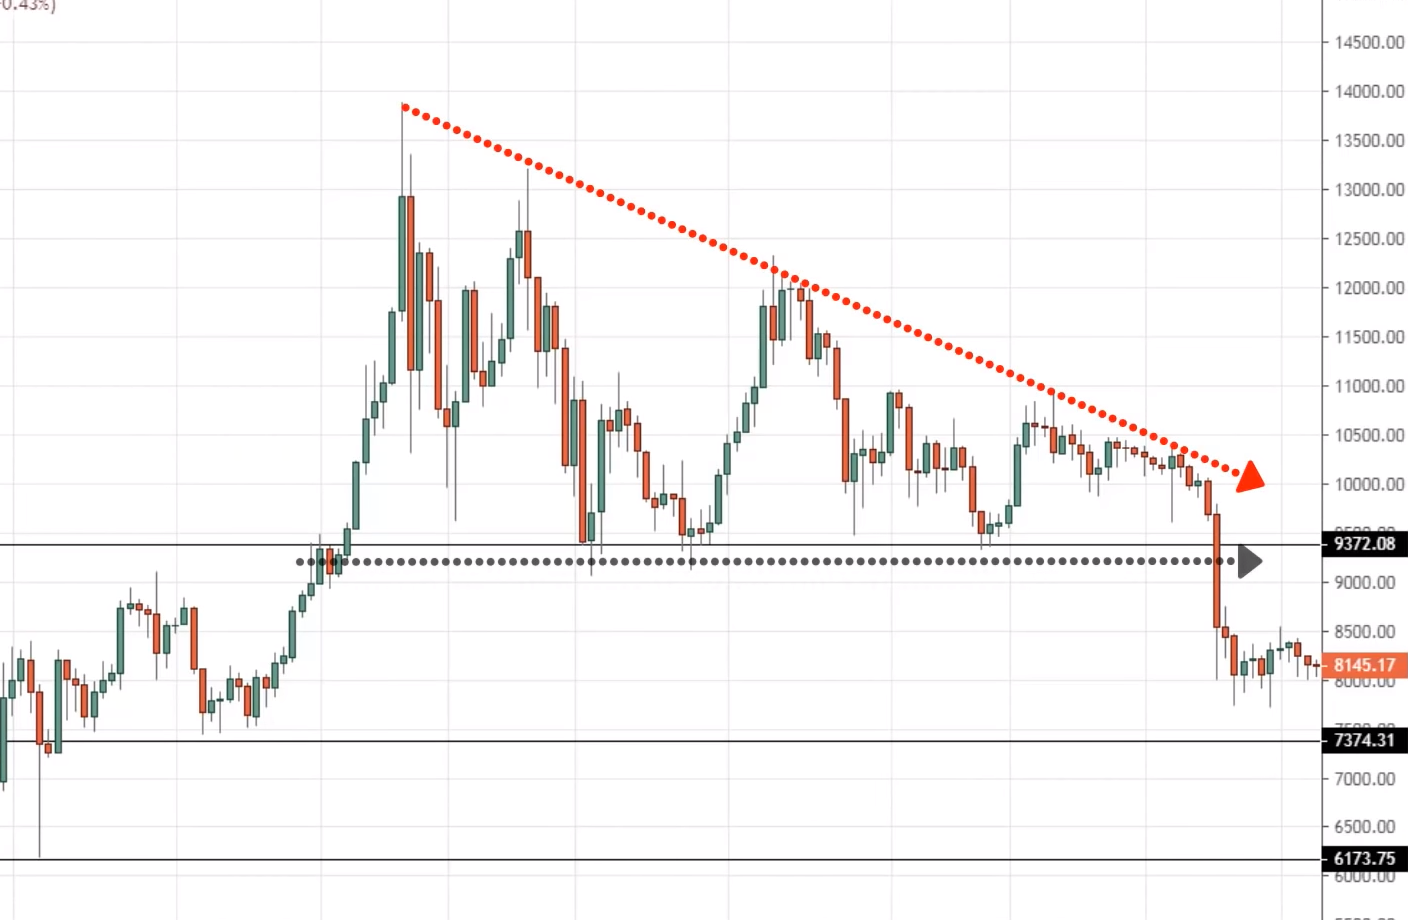
Let’s see another example. Bitcoin, you can see a series of lower highs coming to support.
This to me is a sign of weakness right there. The market is about to break down lower.
So let me just see if I can find an example to illustrate this concept, this concept is important.
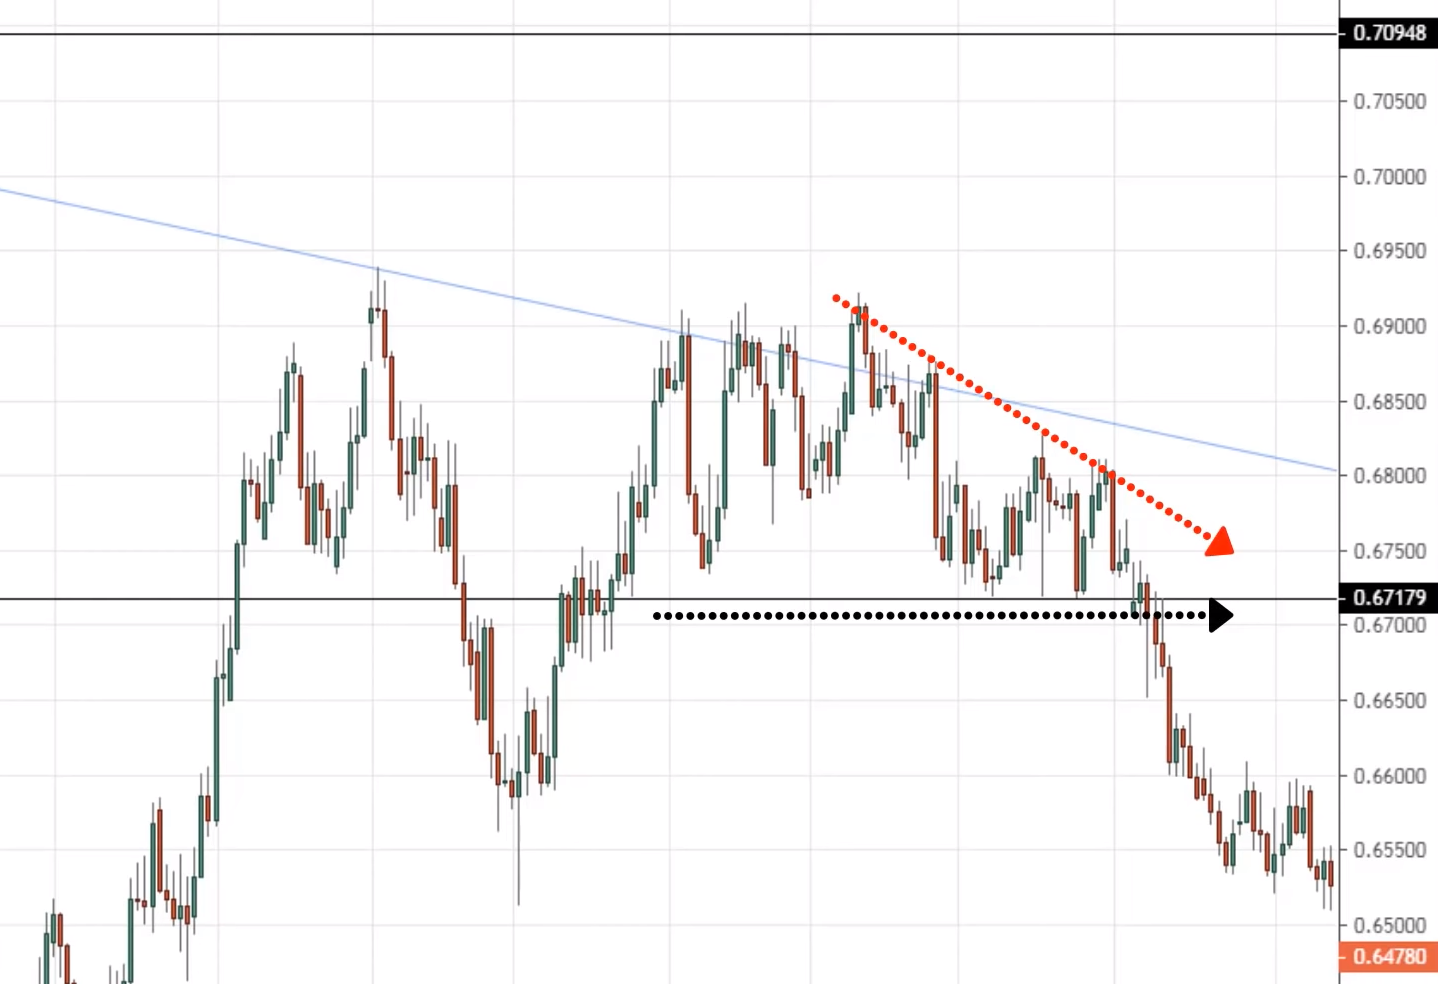
So now the one over here is not as clean as the Bitcoin example, but still, you can see a series of lower highs coming into support.
Again, it's a sign of weakness. The market is weakened, is likely to break down.
So the key thing here is again, higher lows into resistance is a sign of strength and lower highs into support as a sign of weakness.
Setting stops below support
- Easy to get stop hunted
- Set your stops a distance away from SR to avoid stop hunting
So here's the thing, when you set your stops, let's say just below support or above resistance, it makes it easy for you to get stop hunted.
What do I mean by that? So let me ask you this question.
Let's say that the market is in a range and it comes into support before it rallies off, it spikes down lower, then it goes up higher.
So when you buy at support on the brief rally over here, you set your stops below this low or you get stopped up by this spike down lower.
Has it happened to you? Or how about this? The market could be trending. Let's say the market is trending.
Then market breaks below let's say market goes down, then it breaks below this swing low. So we thought there's a break-off swing low, there's a breakdown, you go short.
And where do you put your stop loss?
Well, you put your stop loss just above this swing high. And what does the market do?
It comes up to the swing high and then collapses lower, and then you get stopped up again.
This is the mistake to avoid, you don't want to be putting your stop loss just below support or above resistance.
You want to set it in a distance away from support resistance to avoid this type of stop hunting that goes on.
So let me just give you an example...
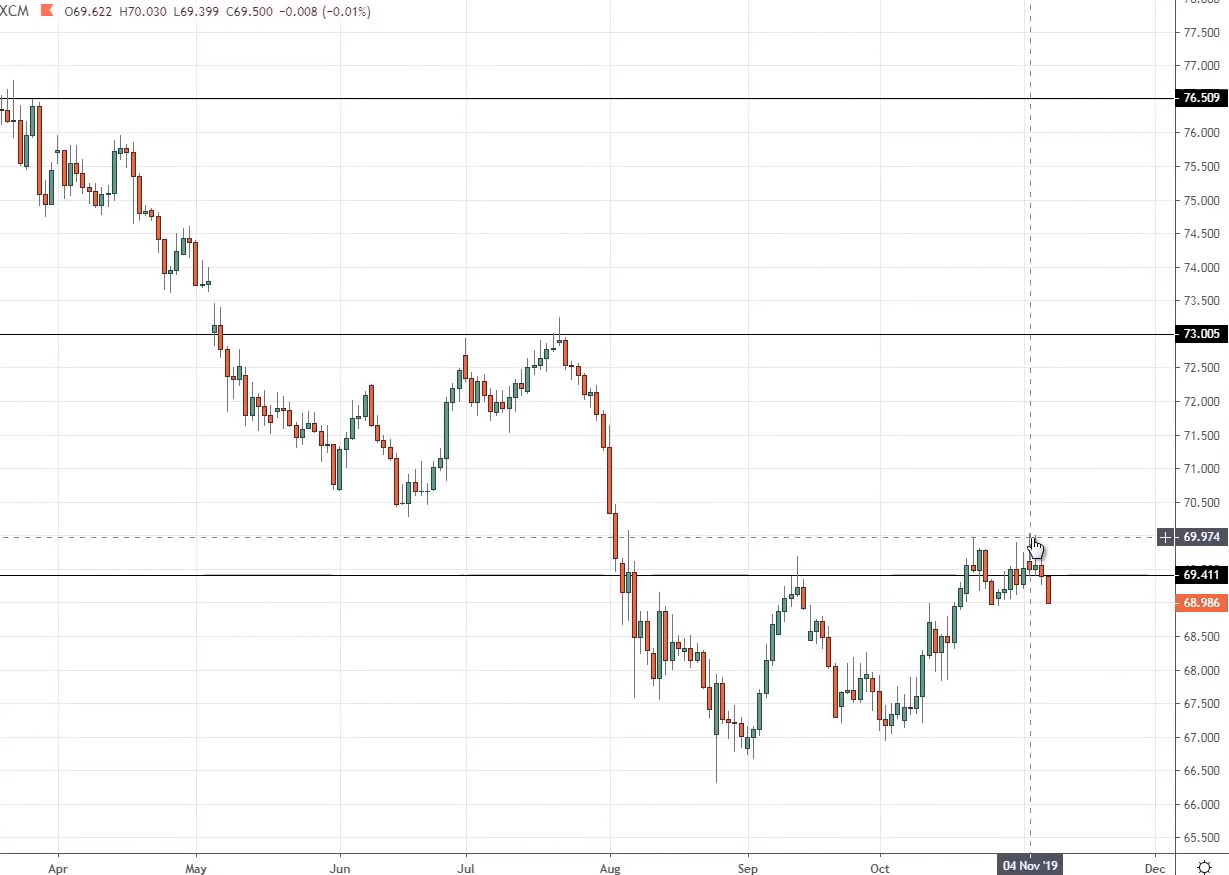
So if you look at his chart, NZDJPY here.
You can see over here, the price looks bearish.
The market looks bearish, breakdown of this swing low. This is a trend continuation trade, you have a series of lower highs and lower lows.
The market is in a downtrend, let me go short, where do you put your stop loss?
You put your stop loss just above this swing high after all this is where the highs shouldn't get invalidated because if the price breaks above the swing high or the downtrend are over.
So that's why you put your stop loss at this swing high...
Then what happens?
The market somehow knows what you're doing. Hits your stop loss above these highs, swings it a second time, we can see swings at it twice before it finally reversed towards the downside.
You can see this phenomenon happening again right now, price hitting down lower, then it swings up, pick up the highs, comes back down, possibly hitting down lower finally.
So we can see that traders that set their stops just above resistance are going to get stopped out.
This is important because you don’t set your stops right just below support or above resistance.
Let me give you another example.
This is the lowest on oil, price came down towards these lows, spiked through the lows before it rallies up higher again.
So here's what happened, price on this oil, It came down below these lows of support before it did a false break and rally up higher again.
Traders who set their stop loss below this low got stopped up over here. And then this phenomenon happens again.
Traders again who set their stops above these highs, the price went up higher, start to reverse, have their stop loss above this high, maybe even above this high.
The market spiked up all the way and then reverse. Again, setting your stops above these highs would likely have got you off the trades before the market could even move in your favor.
How do you set your stop-loss?
So now the question is, how do you set your stop loss in such a way that you know it prevents this type of stop hunting from happening to you?
Here's my suggestion, let me just give you an example.
Let's go NZDJPY.
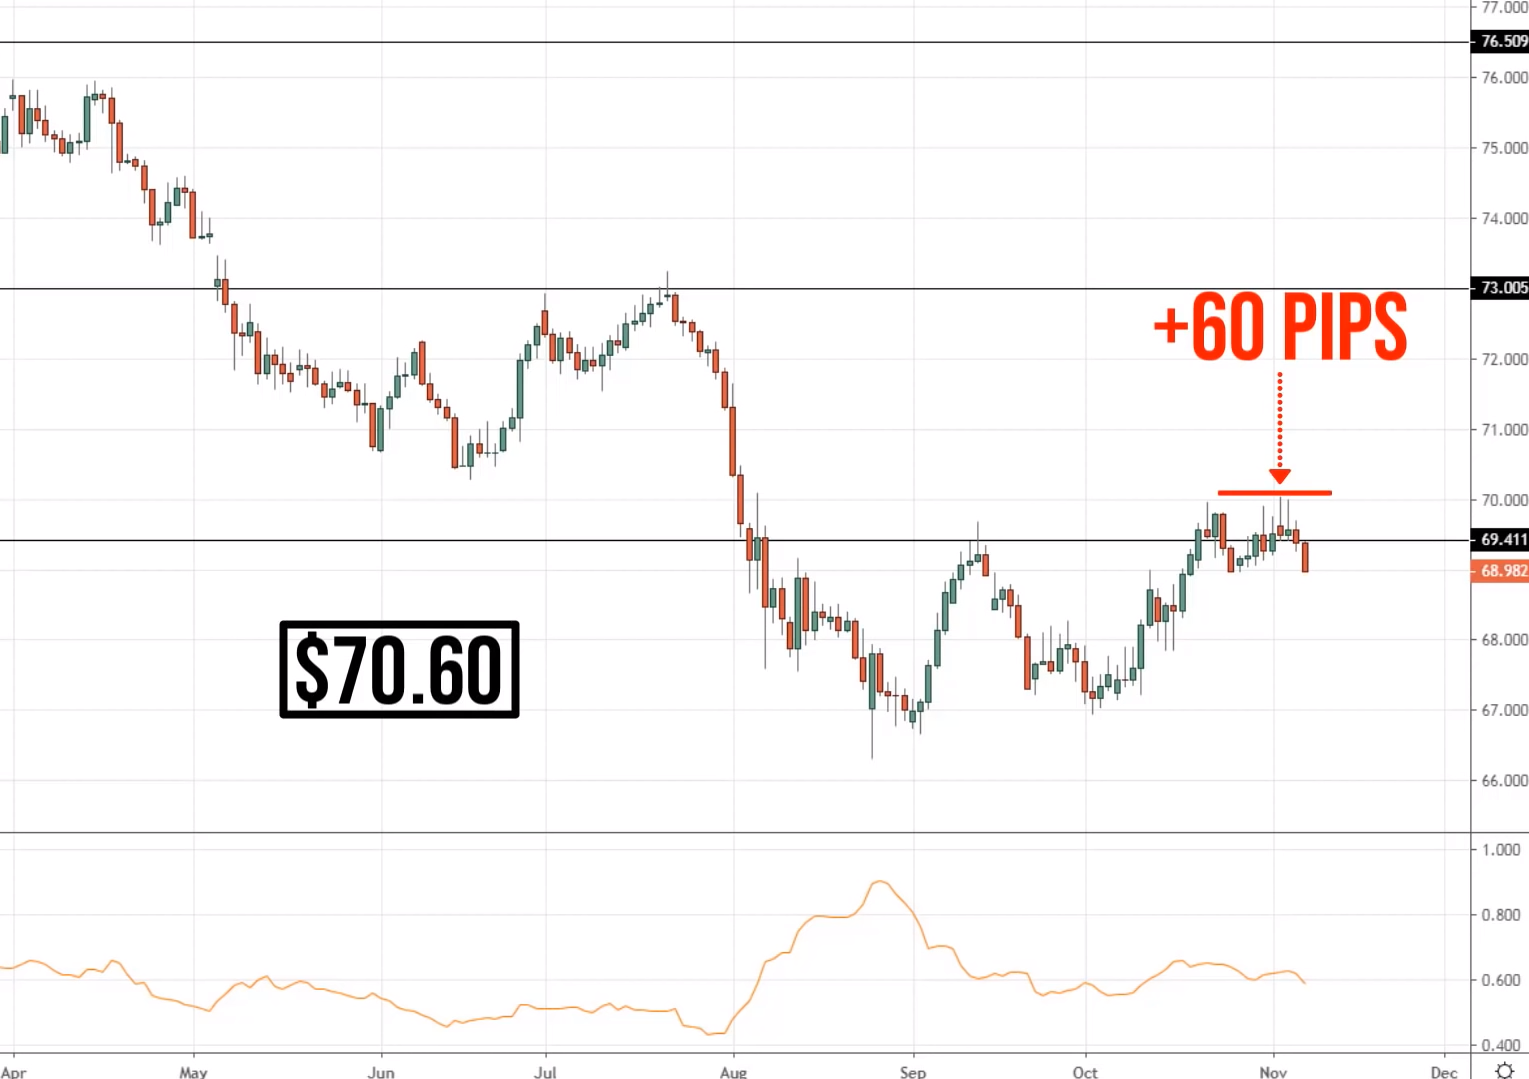
The prices at this area of resistance, you know that you don't want to just set your stops above the highs you might get stopped out on a spike.
What I'm going do is use the ATR indicator to help you add a buffer to your stop loss.
I typically go with a 20-period ATR and I use the SMA.
Not that it makes much of a difference it’s just my preference. And you can see them right now, one ATR is worth about 60 pips.
So what you want to do is to find out what's the highest over here, and you add on 60 pips.
Let's say the high is currently $70. Your stop loss would be at 70.60 cents. That is your stop loss or you give it a one ATR buffer over here.
That's how you would go about setting your stop loss or if there's a case your stop-loss would now be somewhere about here.
This means that even if the price will spike up higher and come back down, you will still likely be in the trade because your stops are now away from support resistance.
It’s away from this market structure where it’s prone to stop hunting.
Buying chop move into support
- Too many obstacles in your way which reduce your profit potential
Another mistake that traders make is that they buy a chopping move into support.
What do I mean by this?
Here's the thing, whenever you trade support and resistance you want to be buying when there are little obstacles in your way.
For example, if you look at this price goes up, comes down, comes back low to support this is the type of price action that you ought to be buying when there is just one nice, clean move into support.
This to me is ideal because the nearest obstacle in your way is possible at this area of resistance over here. So your profit potential is pretty decent.
From here to here, let's call it your profit target.
Now there are times where you don't get a nice clean move into support.
Sometimes you might have something like this, which is very common. Sometimes you might get something like this price forms a choppy move into support.
Now if you were to be buying this support, where is the nearest obstacle?
Ask yourself.
If you look at this chart, the nearest obstacle is knowing the possibilities to be at this swing high over here. So this greatly reduces your profit potential.
Now your profit potential is only this portion here because all these lower highs are in your way where potential selling pressure could be looking around.
Let me just give you an example
Look at this chart of USDINR, this is an example of a setup that I don't want to be buying.
You can see this is an area of support. If I were to be buying right now, the price will be coming shortly into this swing high over here.
And that is an obstacle in my way. I would very much prefer a nice clean move into support. So my profit potential is much more.
Another example you can see over here:
You don’t want to be buying at this high because over here is just this swing high where selling pressure.
It could be looking around to move the market against you or to push the price against you.
You don’t want to be buying right when the price is near obstacles when it’s just in front of resistance and you don’t want to be shorting just at the hit of support.
So how should you trade this?
The way I do it, I like to see a nice clean power move into a level.
For example, this is what I call a nice, clean power move:
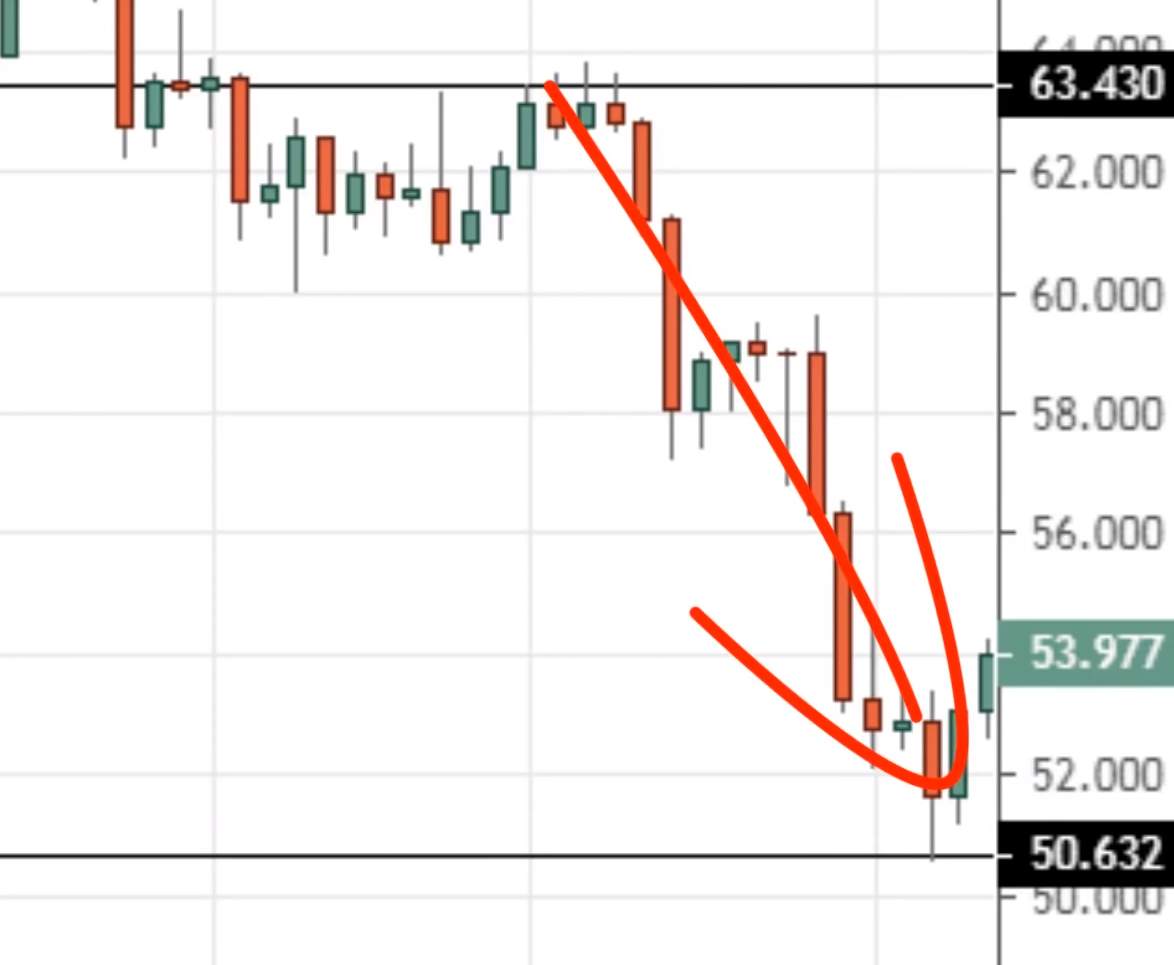
The market just came down so strongly into a level, so I know that if I were to be buying on the reversal of this candle, the nearest obstacle in my way is this swing high over here.
So there's a distance, right for the price that moves in my favor before you face that obstacle.
Another example, GBPUSD:
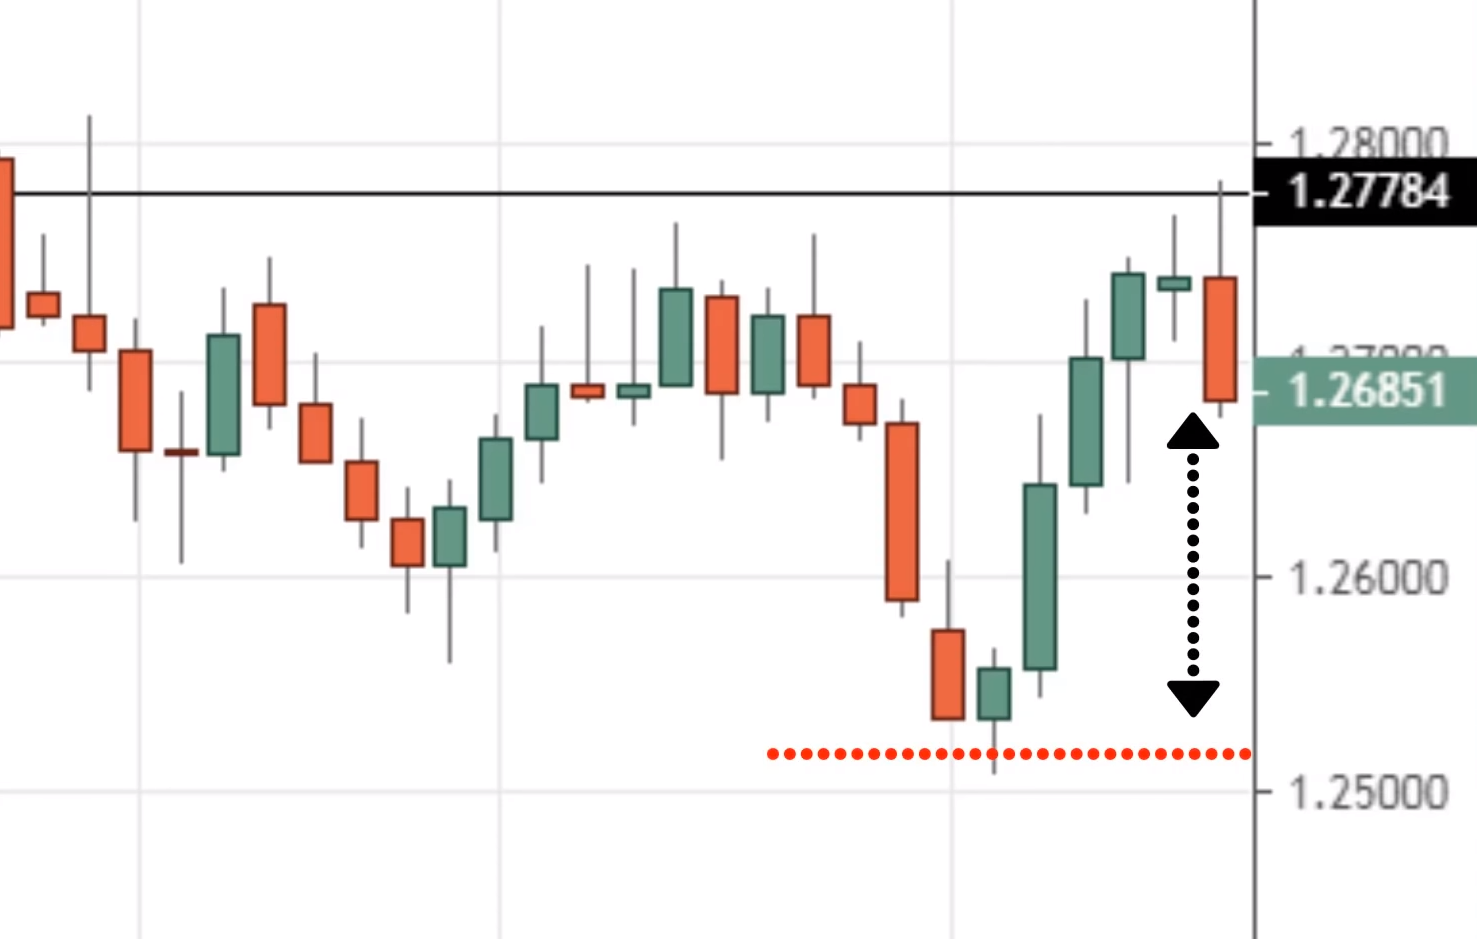
If you look at this and this reversal. The nearest obstacle in my ways at this swing low over here so there's a distance where the price can move.
Where there isn't any opposing pressure to cover it and push the price against me.
So this is what I mean by, I look for a clean move into a level.
Usually when there are a clean move and a power move into a level. The reversal is more swift.
That's why I hate trading choppy move into a level as explained earlier. That's the tactic that I have for you.
Don’t buy a choppy move into support or resistance. There are too many obstacles in your way.
It reduces your profit potential and there's a lot of levels or areas in the chart where the opposing pressure could come in and twist the direction of the trade for you.
Treating SR as lines on your chart
Two types of traders:
- FOMO
- Cheapo
And finally, the fourth mistake is that traders treat support and resistance as lines on your chart.
And here's the thing, support, and resistance they are not lines on your chart, even though you see I draw them as line, but I treat them as an area.
Why is that? And the reason is simple
There are mainly two groups of traders out there.
What do we call it?
FOMO Traders
Fear of missing out traders. For example, whenever the price briefly touches into support or just come into it area they quickly want to buy, they don't want to miss the move.
This is the traders who have the fear of missing out, they buy as soon as possible when the price reaches support.
Cheapo Traders
These are the group of traders that want to get in at the best possible price at absolute lows of support and absolute highs of resistance.
That’s where they want to enter the trade. So when you have these two group of traders, that's where you support becomes an area on your chart.
So when you merge these two groups of traders, support becomes an area on your chart. One way you can go about trading it as an area or your chart is to draw it as an area.
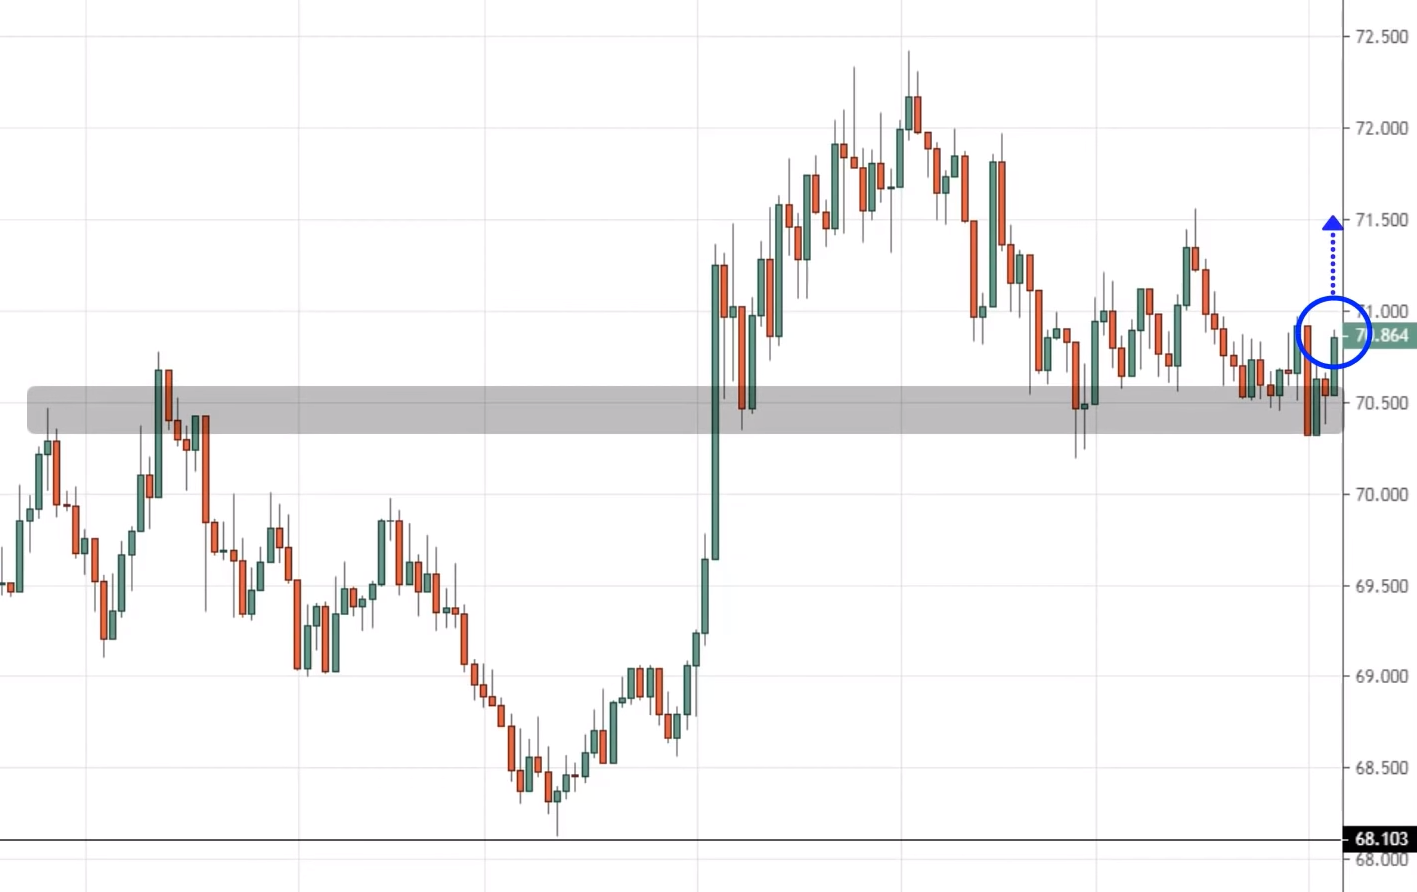
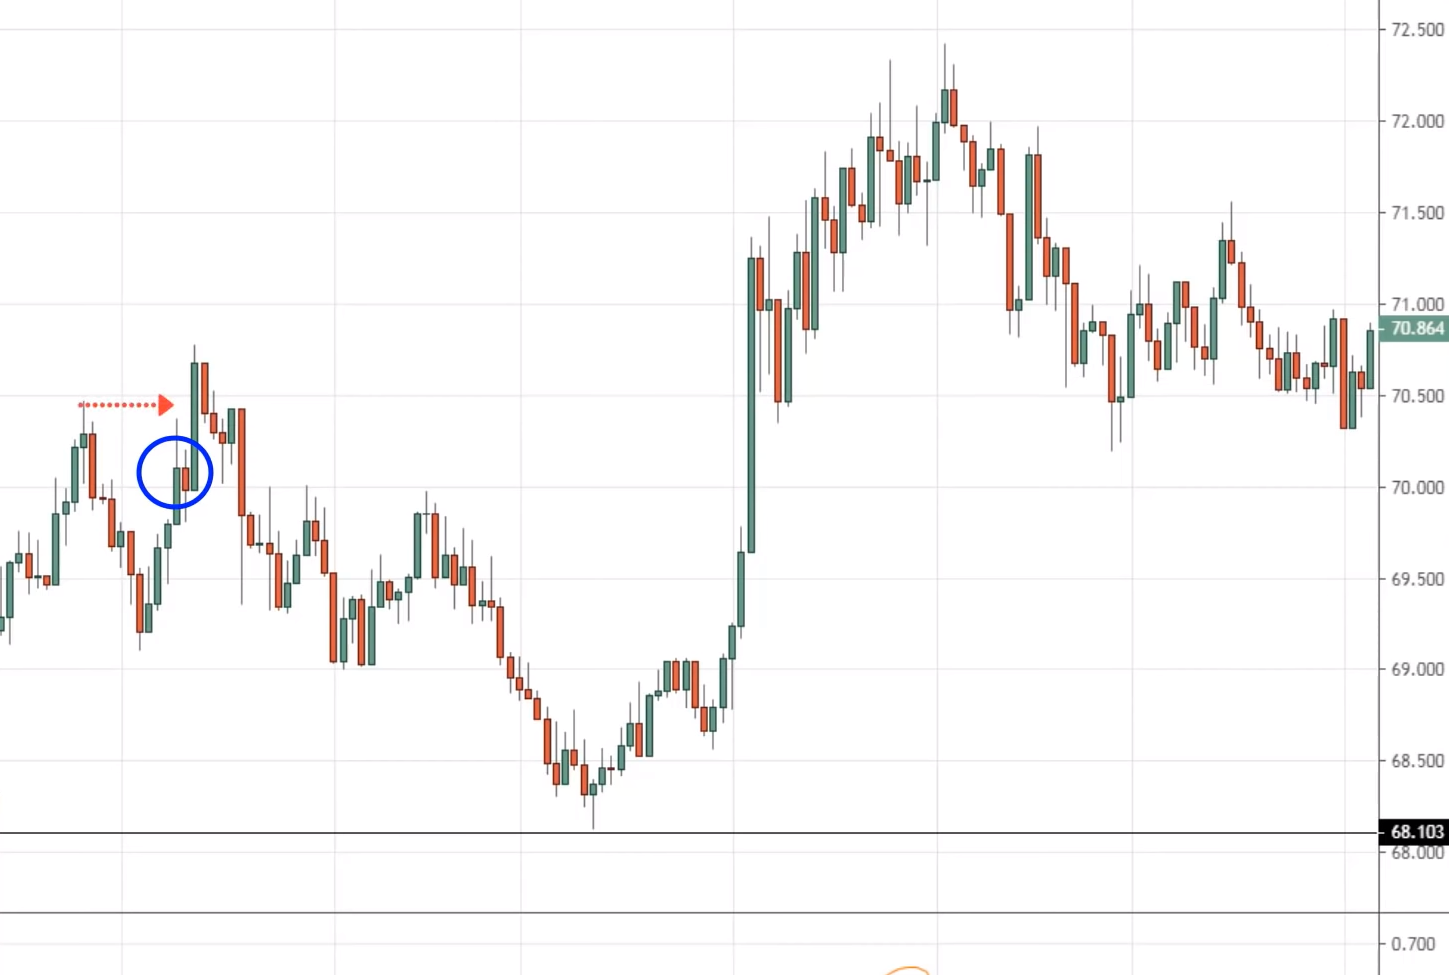
In this case, what I could do if I want to, is I could draw support and resistance areas on my chart. So I can use the rectangle tool. In this case, I can draw it like this.
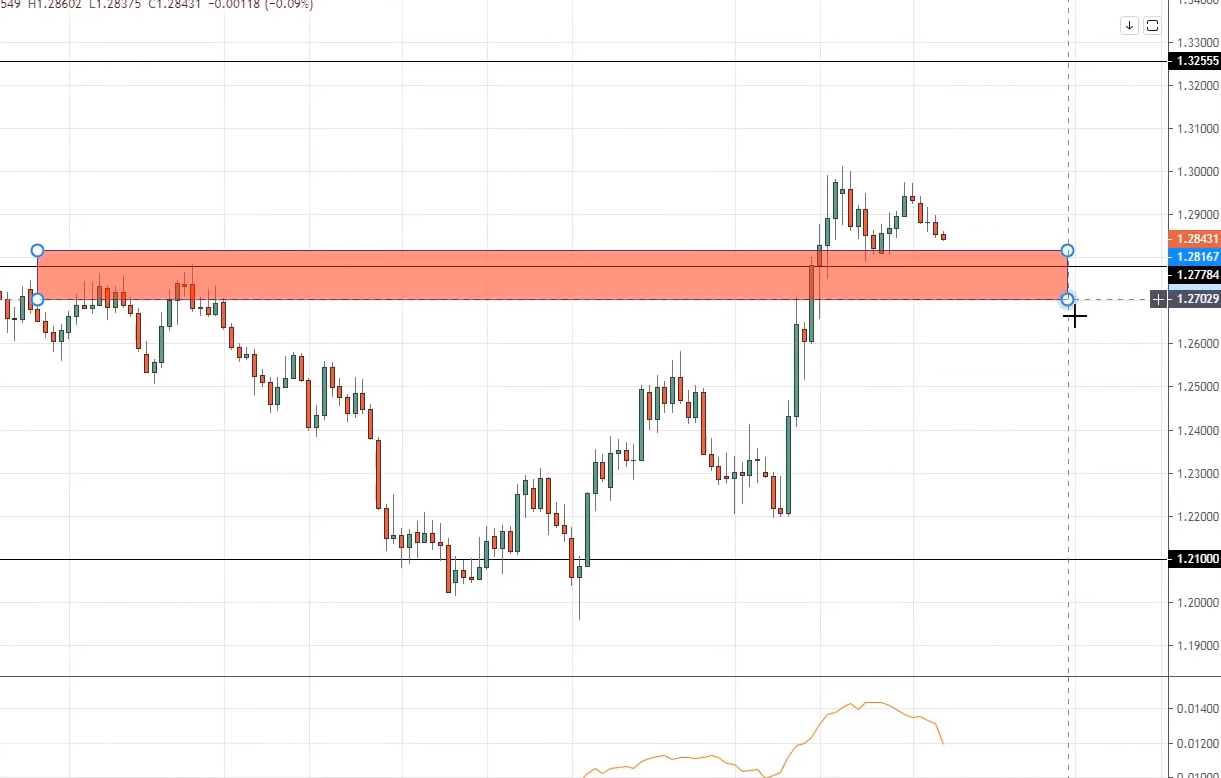
This becomes an area, something like this.
This is how we can treat support and resistance as an area on your chart.
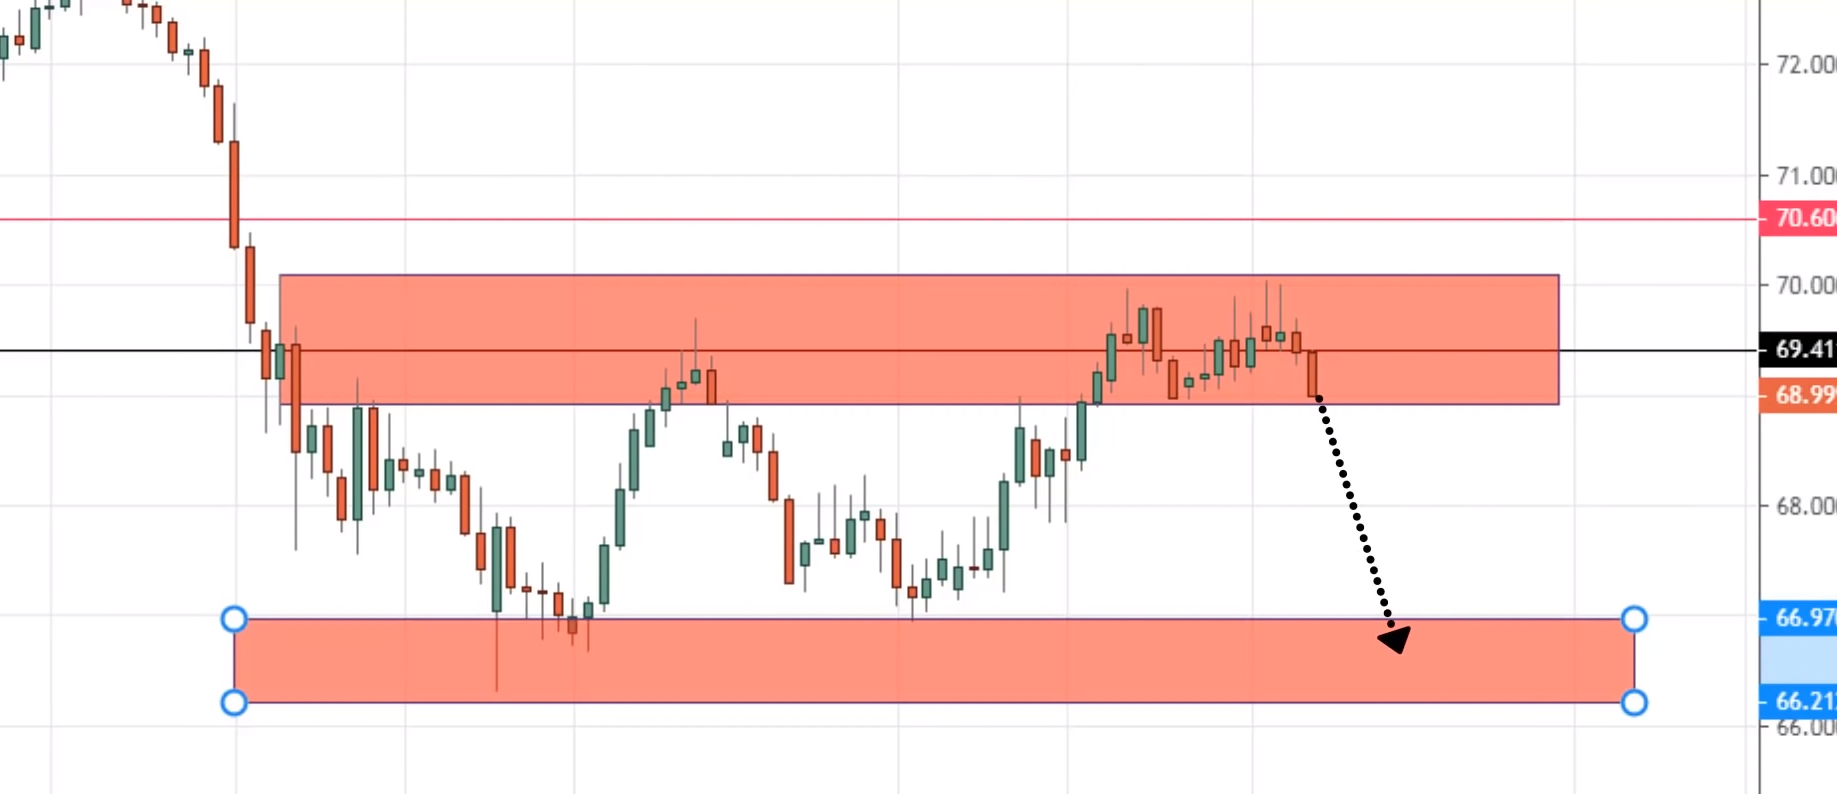
We just do for this lower one as well, so this means if the price when it comes down lower. And it touches here, you know that price is at an area of support.
You want to be alert to potential buying opportunities at the same time in the back of your head, you also know that this is an area the price could come in deeper into support.
Possibly even to these lows before it reverts. Now once you look at it as an area on your chart, not a line on your chart you have all this a plan at the back of your head knowing what to do.
If the market starts to show signs of reversal, just because you treat it as an area on your chat, not a line.
This is important if you're always struggling to identify your support and resistance level treat it as an area, use the rectangle tool I just shared with you.
And I believe it will help you spot your support and resistance areas better.
Recap
- The more times SR is tested within a short period, the weaker it becomes
- Don’t set your stops just below support (or above resistance)
- Don’t treat SR as lines on your chart- It’s an area

