#13: Best Forex Trading Entries
Lesson 13
Hey, Hey, what's up my friend? I know you're watching this video because you want to better time your entries. Perhaps you are the type of trader that always seems right to be entering the trades too late.
By the time you entered the trade, the market does a reversal or pullback and you get stopped out of the trade.
Maybe you're the type of trader that somehow you're always entering your trades too early. You get the direction, but the funny thing is that you're too early.
You get stopped up before the market continues to move in your favor.
So if you happen to fall in any of these two categories, don't worry, because, in today's video, I'll share with you a few of my secret techniques.
To help you better time your entries with deadly accuracy.
So here are a few things that you will discover.
- Trade from an area of value- not away from it
- Get help from the higher timeframe, here’s how…
- Don’t chase big moves, do this instead
We've talked about why you must or why you should trade from an area of value, not away from it.
How to get help from the higher timeframe and why you don't want to be chasing big moves in the market, but you should do this instead.
1. Trade from an area of value- not away from it
This means that you want to avoid taking trades from an area of value.
Let me explain what I mean by this concept…
This is the 30-year treasury bond futures chart on the daily timeframe that tends to respect the 50-period moving average:

You can see that based on this chart, the area of value is about or around the 50 days moving average. So somewhere about here.
If you recall earlier, I said that you don’t want to be trading far from an area of value.
Why is that?
Let me explain why…
If you look at this, if you were to be entering your trades right now, let’s say you buy somewhere here and you know that the area of value is somewhere here:
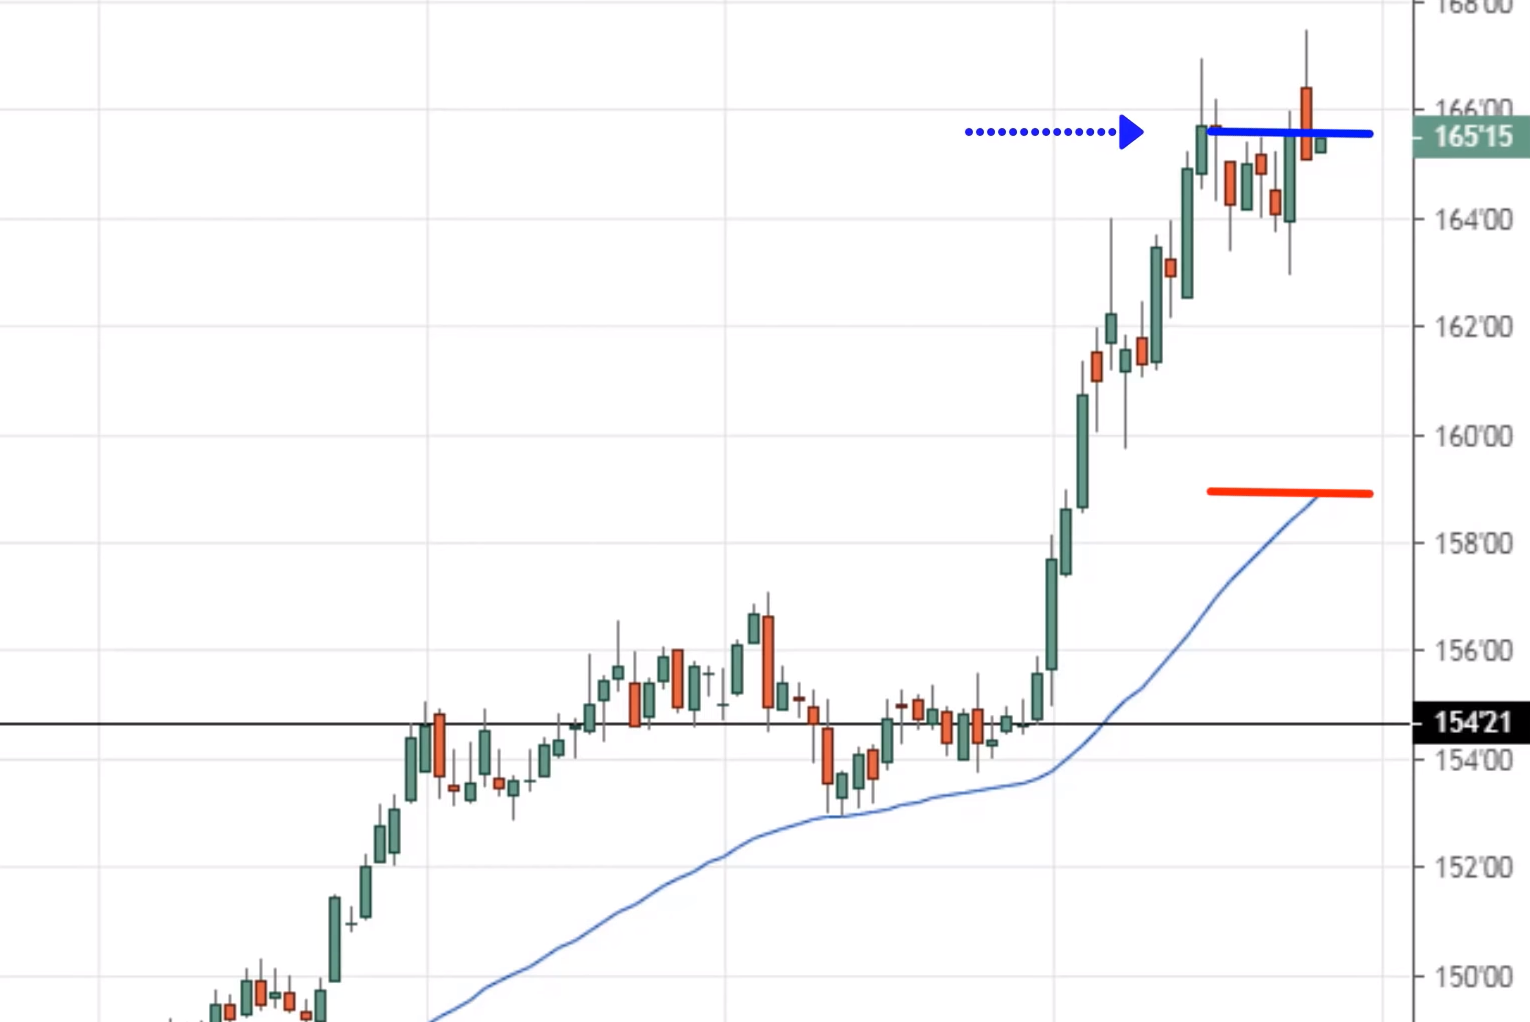
What happens is that this market tends to pull back towards the 50 periods moving average.
So if you were to buy somewhere here, and if your stop loss let’s say it is below this swing low or here.
It’s not going to save you because when the pullback comes, there’s a good chance it’s going to retest back this 50-period moving average and then continue higher.
So if you put your stop loss right anywhere in this area, chances are you’re going to get stopped up.
So this is why I say that you don’t want to be trading away from an area of value, but you want to be trading near an area of value.
Because now let’s imagine this. Let’s say you are patient.
You let the price come to you, you trade from an area of value.
And the area of values over here, let’s say the market retest lower:
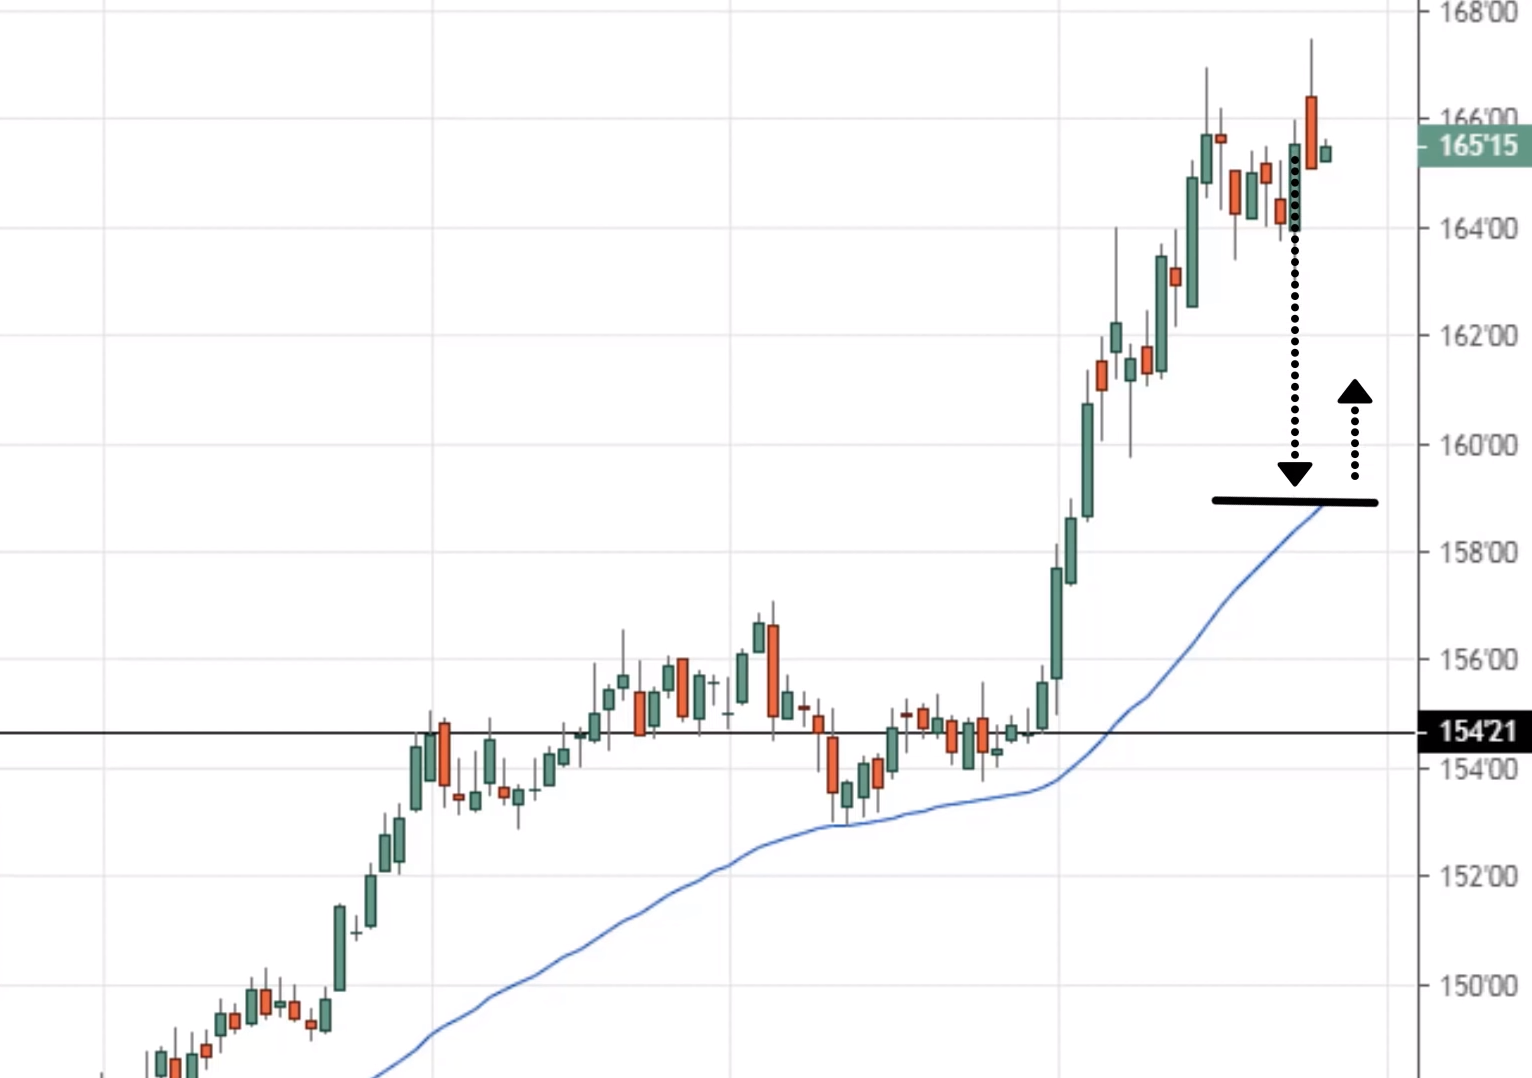
And it maybe had a price rejection closing up slightly higher.
So now if you trade from this area, your stop loss can go somewhere about here, right at distance below the 50 periods moving average, and now you’re trading near the tail end of the pullback where the pullback is.
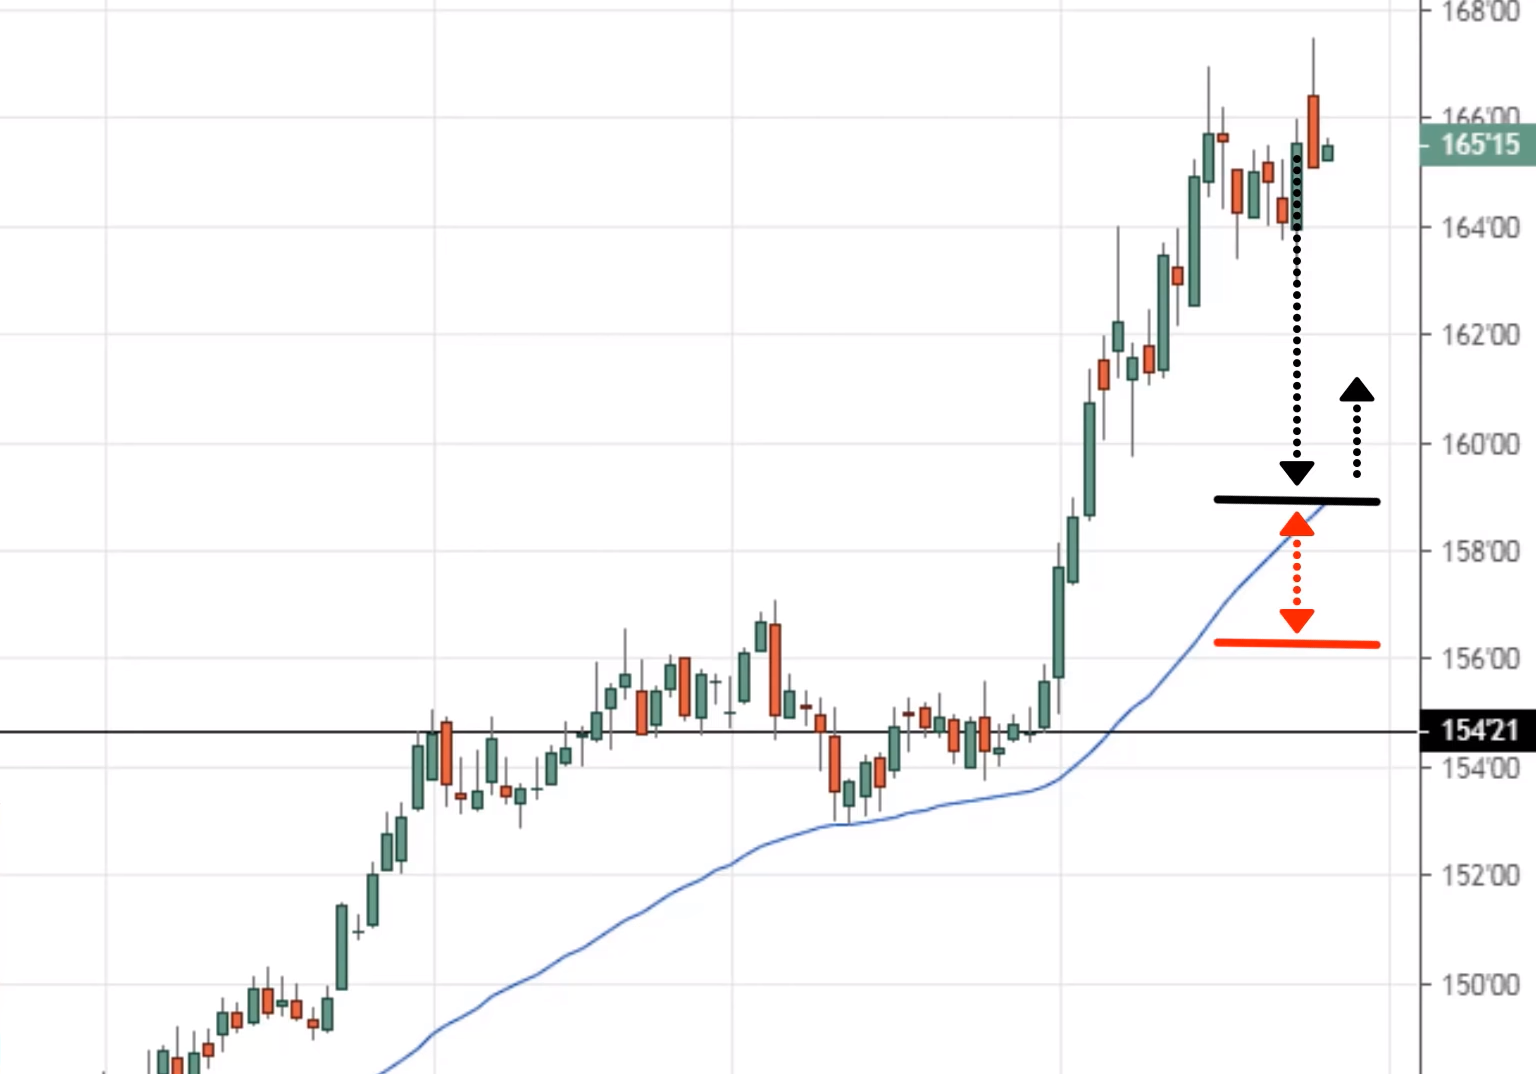
And that offers you a much more favourable risk to reward because the market is now getting ready to make the mix link up higher.
So remember, you don’t want to be trading away from an area of value.
You want to be trading near the area of value. You will have a tighter stop loss. And it offers you a much more favourable risk to reward on your trade.
One more thing to add is that for those of you who look at this chart and say
‘’Oh man Rayner look at this chart it is so bullish man, I can’t wait to get about the move’’
And if you were to enter over here,
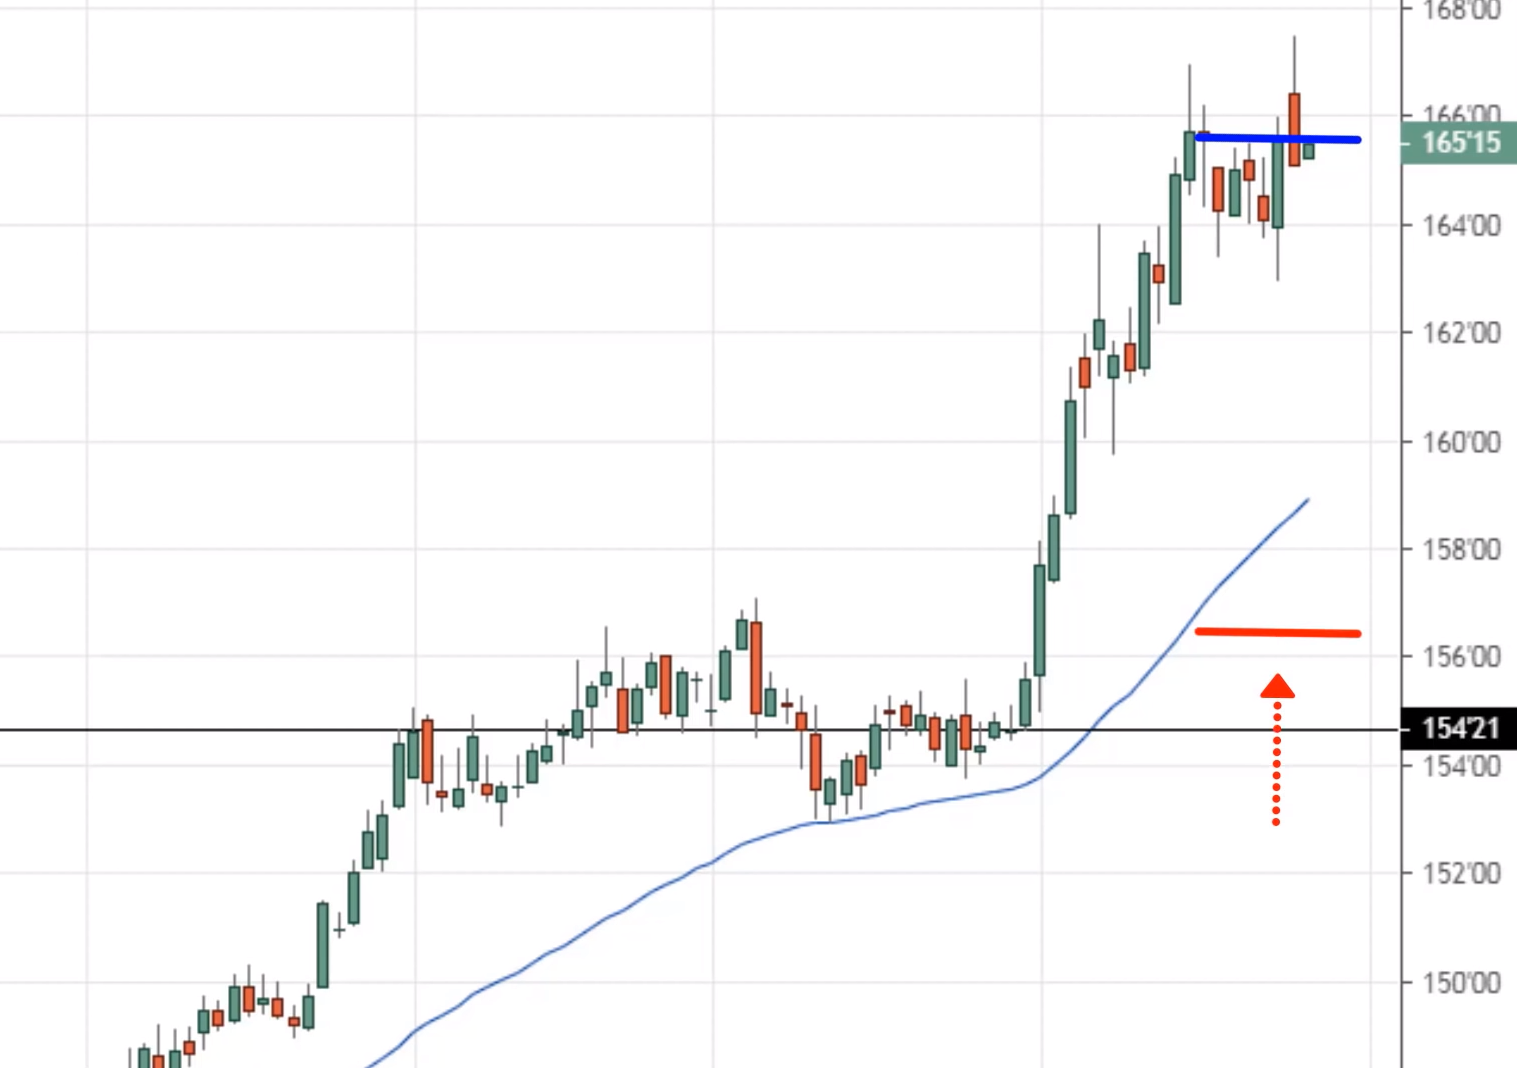
Logically, your stop loss should at least be below this 50-period moving average. It’s going to be somewhere here.
And if you were to enter there, you can see that your stop loss size of it, it’s going to be pretty large.
And you can see that entering your trades far from an area of value. It doesn’t offer you an attractive risk-reward compared to a trader who is patient who let the price comes to them.
Let’s say the price comes down lower to them, let’s say they enter somewhere here, their stop loss at this level, now their stop loss is much tighter.
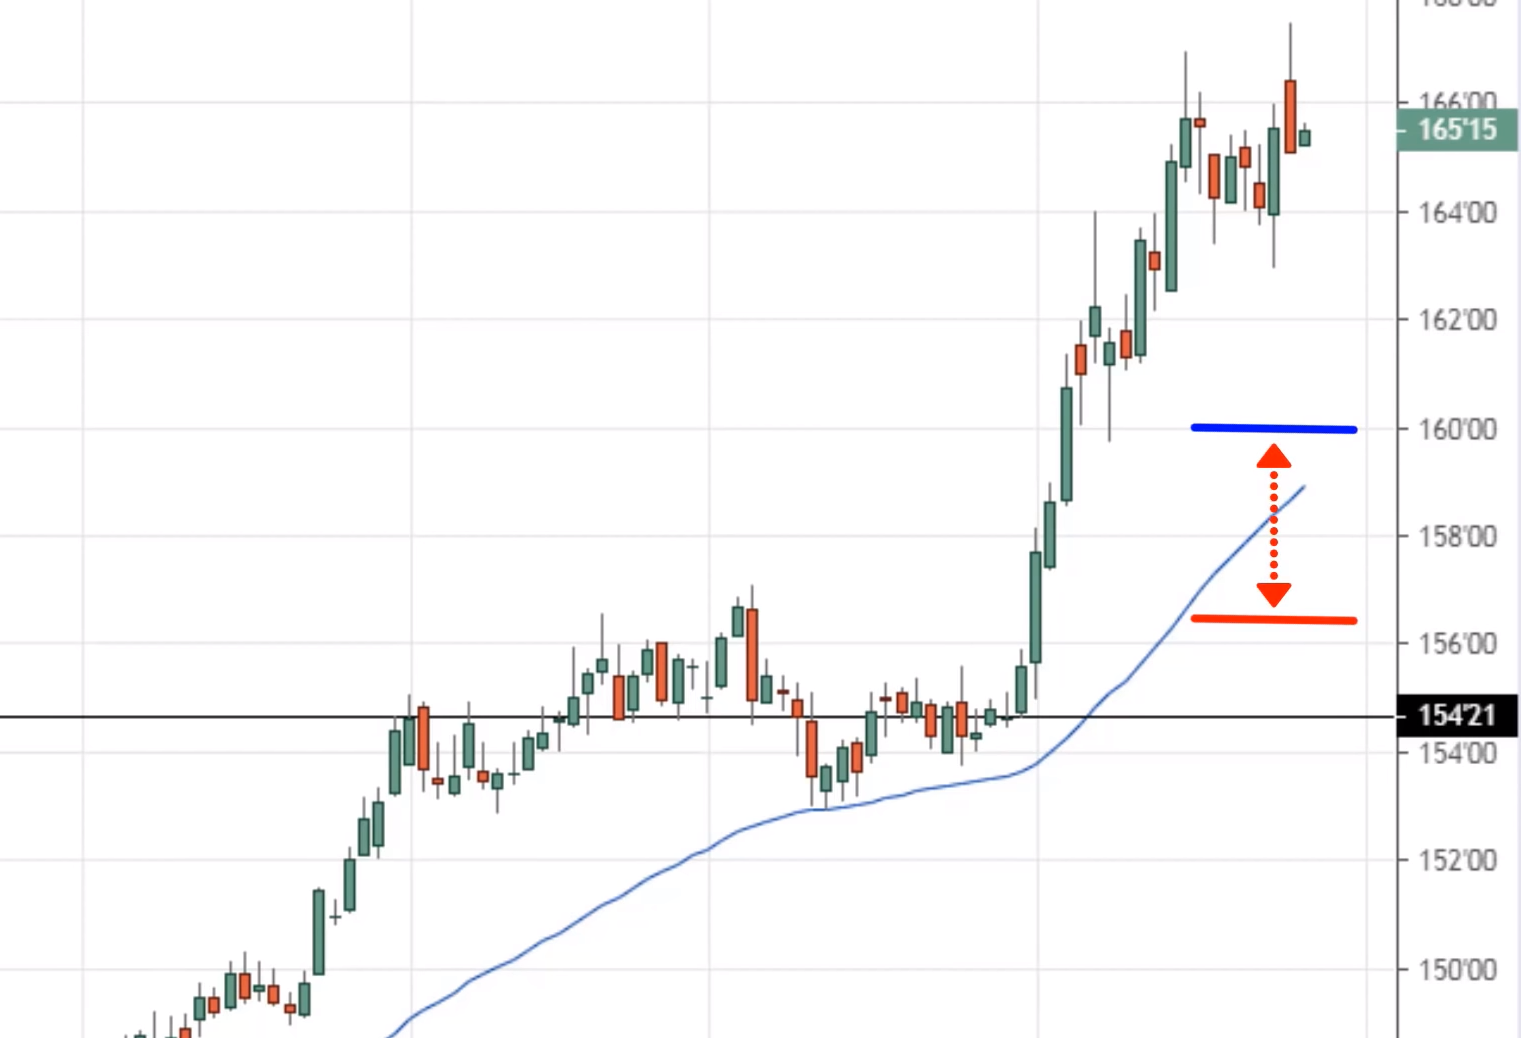
They can afford to put on larger position sizes and still keep their risk constant.
In other words, they’re trading from an area of value. It offers them a more attractive risk to reward. That’s the concept or my secret number one.
2. Get help from the higher timeframe.
So what do I mean by this concept, let me just illustrate that over here.
Let's say you look at a chart on maybe the 4HR time frame.
And the price is in this range over here near this lows at this point, and here on the lower timeframe.
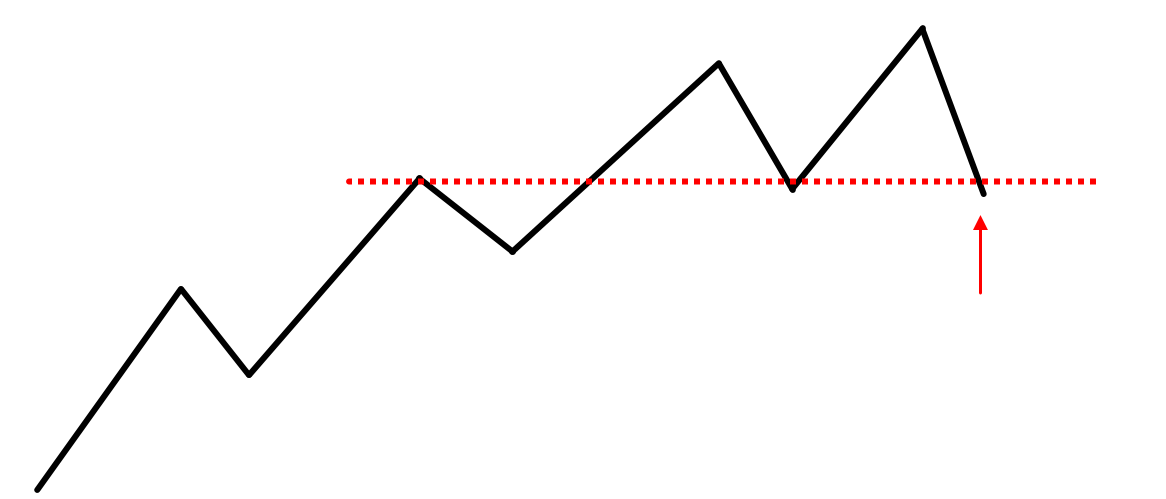
So this area will be more significant. If it coincides with a higher timeframe level, if it coincides with a higher timeframe market structure, like support.
So if let's say this is on the 4HR time frame, you know that this level over here is going to be more significant.
If on the daily time frame it looks something like this. You've seen an uptrend and it comes back and retest this level of previous resistance.
So now this lower time frame support is leaning against a higher timeframe market structure and that improves the odds of your entry.
So let me give you an example. If you look at this 4HR time frame at this point.
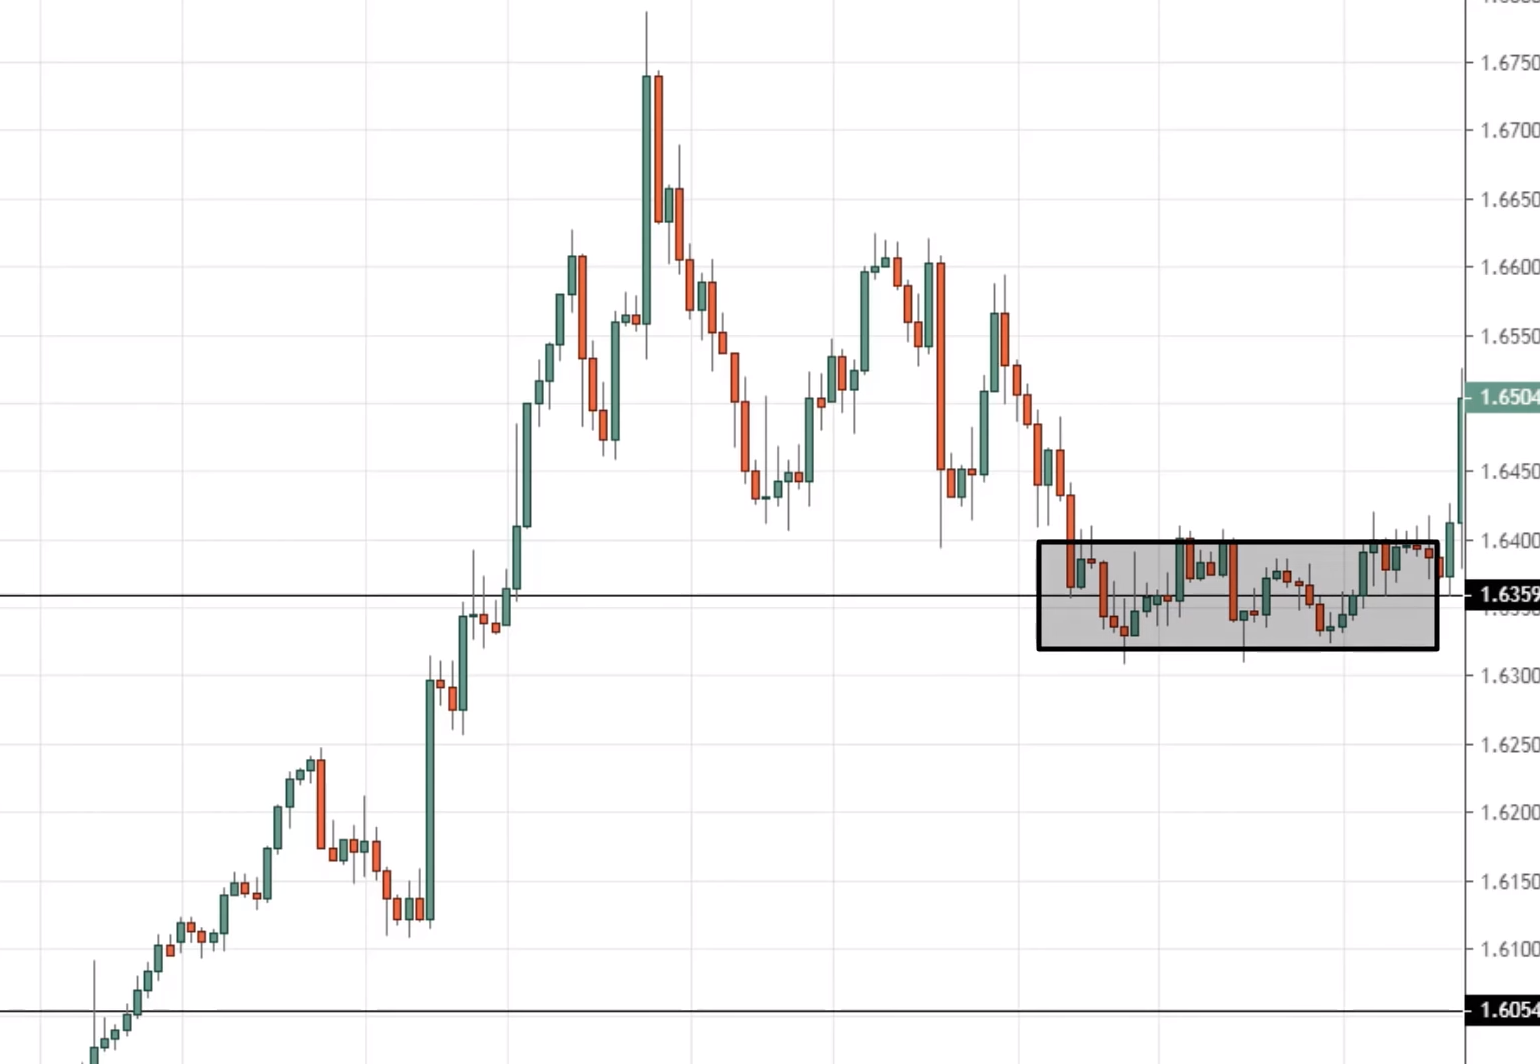
You might look at this and say, this is nothing significant.
The price is now in adjusting or forming a range over here.
Nothing special.
Well, remember what I said, if the price is leaning against a higher time frame structure, that level becomes even more significant.
So you can see that over here...
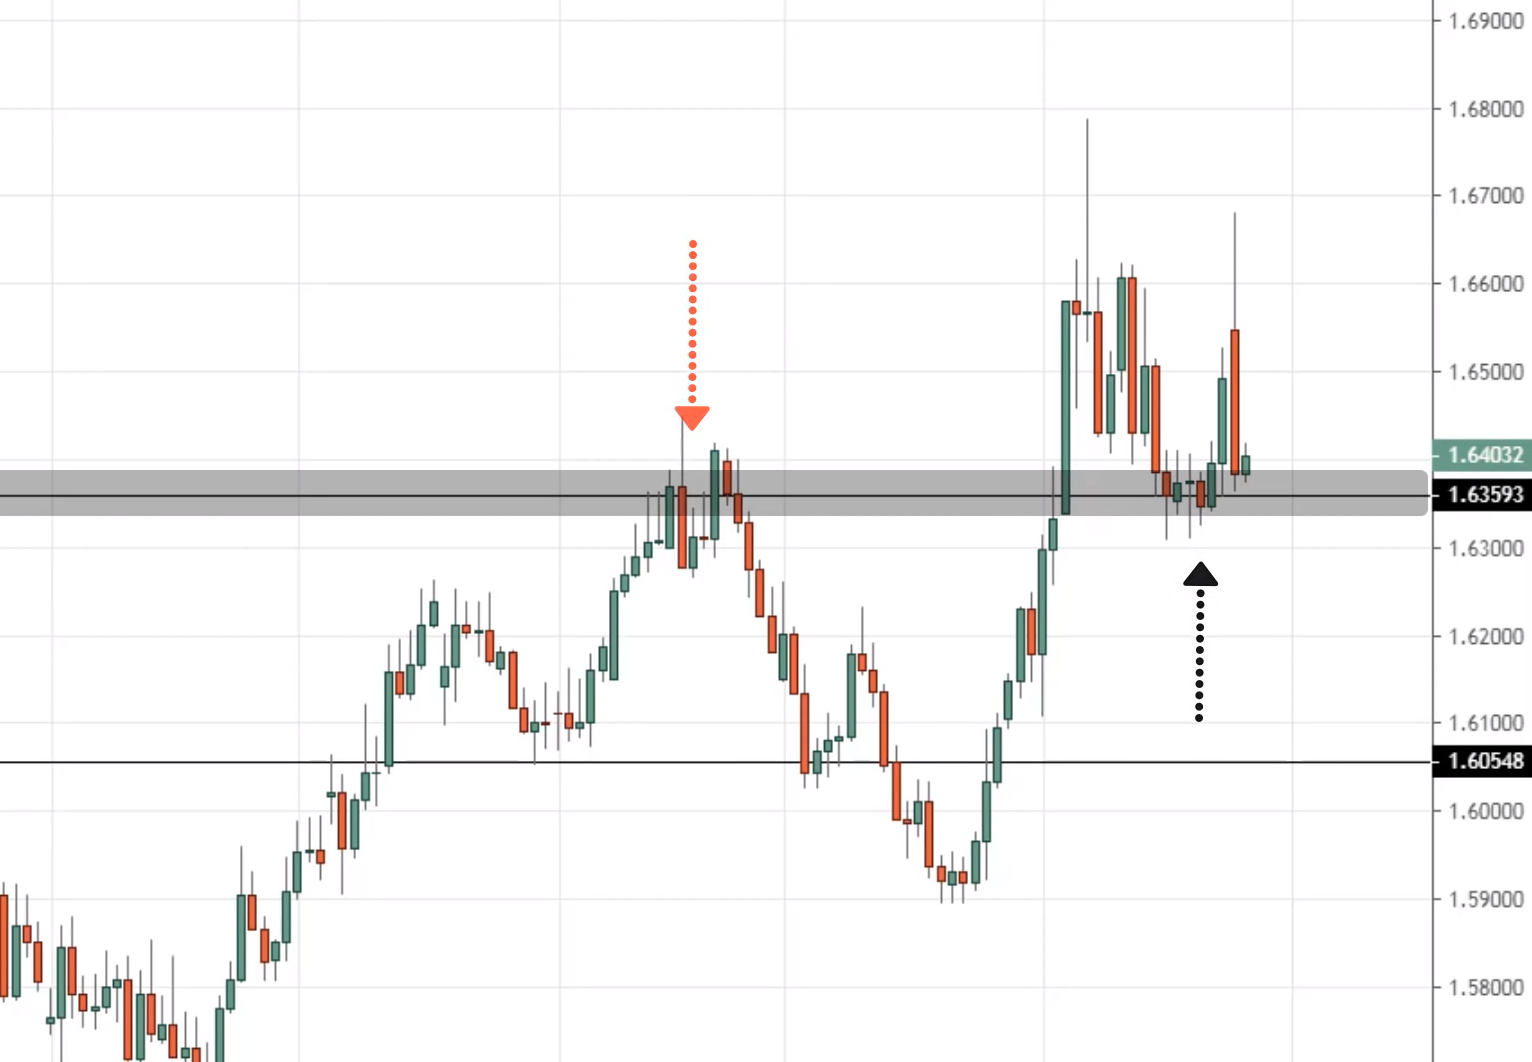
This area over here is leaning against a daily timeframe level at this point over here.
This previous resistance, resistance, resistance is now acting as support.
So we can see that the consolidation that you saw earlier on the 4H timeframe, this portion over here.
It's leaning against a higher timeframe, previous resistance, and support. And that's a significant level.
And if you were to have your trades usually leaning against such a higher time frame structure, you will find that the probability of your trades, your entries will be improved.
So in this case, the market did break out, it retested this area of resistance before collapsing.
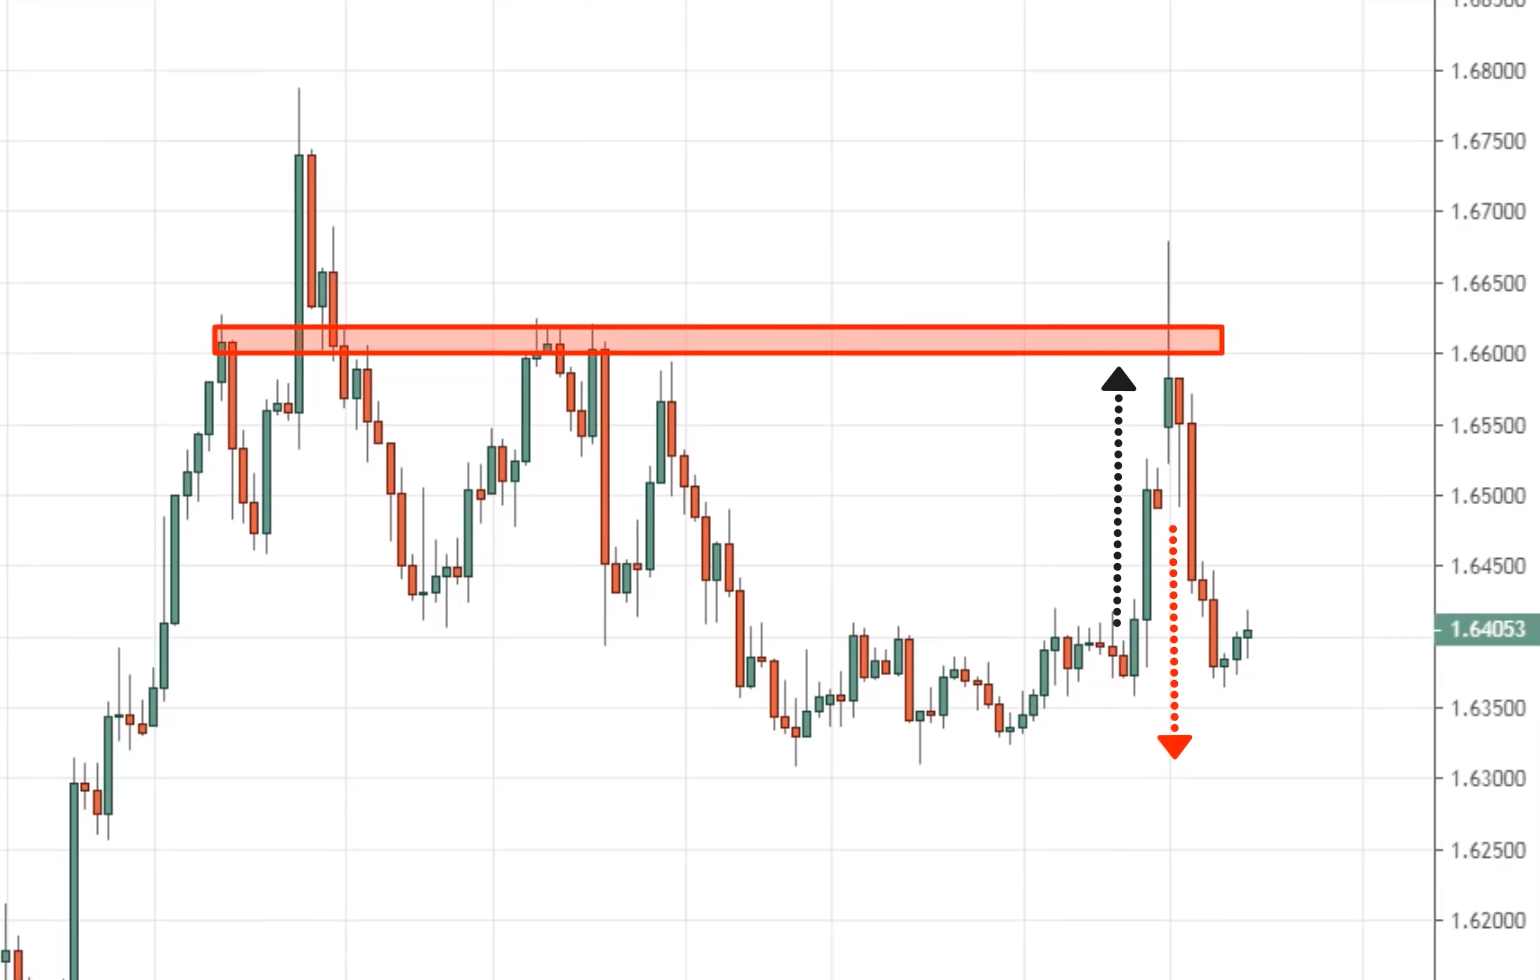
But that's beside the point. The key thing I'm trying to share is paying attention to where the market structure is at on the higher time frame. If it's leaning against the higher time frame, all the better.
So let me give you another example, because this concept it's important again, the 30-year Treasury bond.
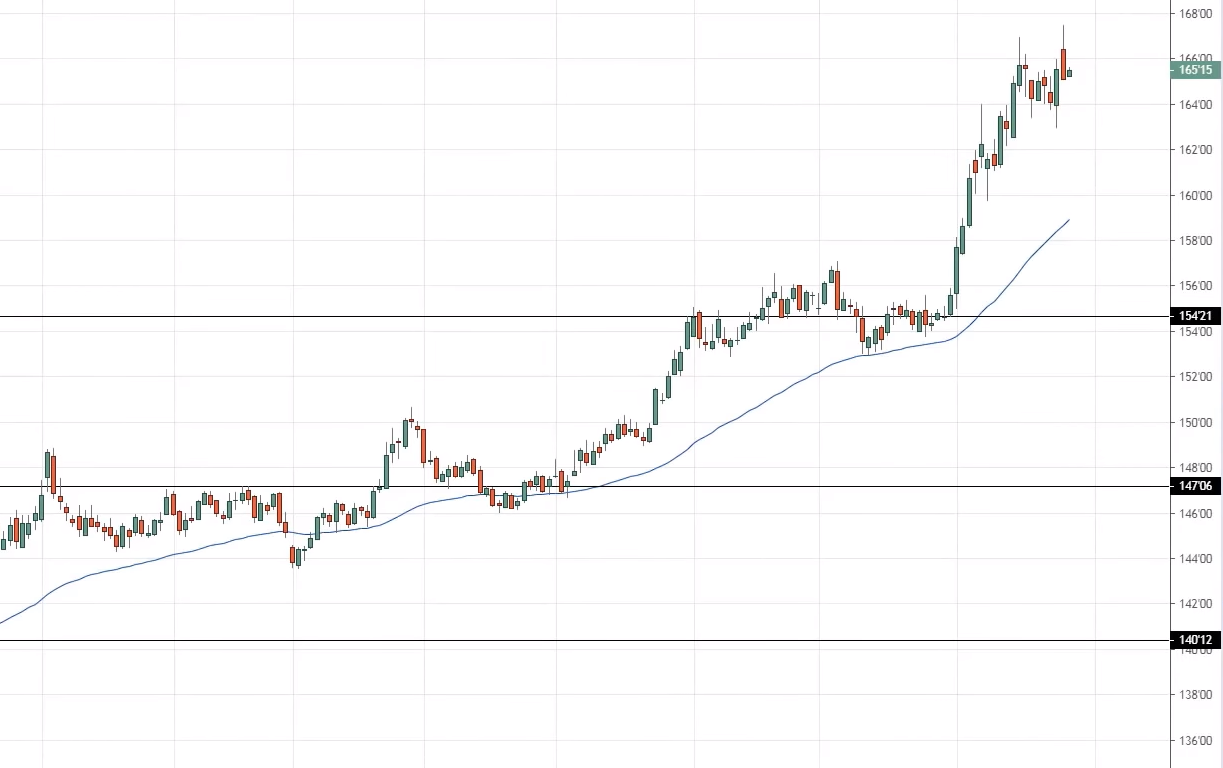
Let's look at the daily timeframe and let's look at the lower time frame. Let's look at the eight-hour time frame.
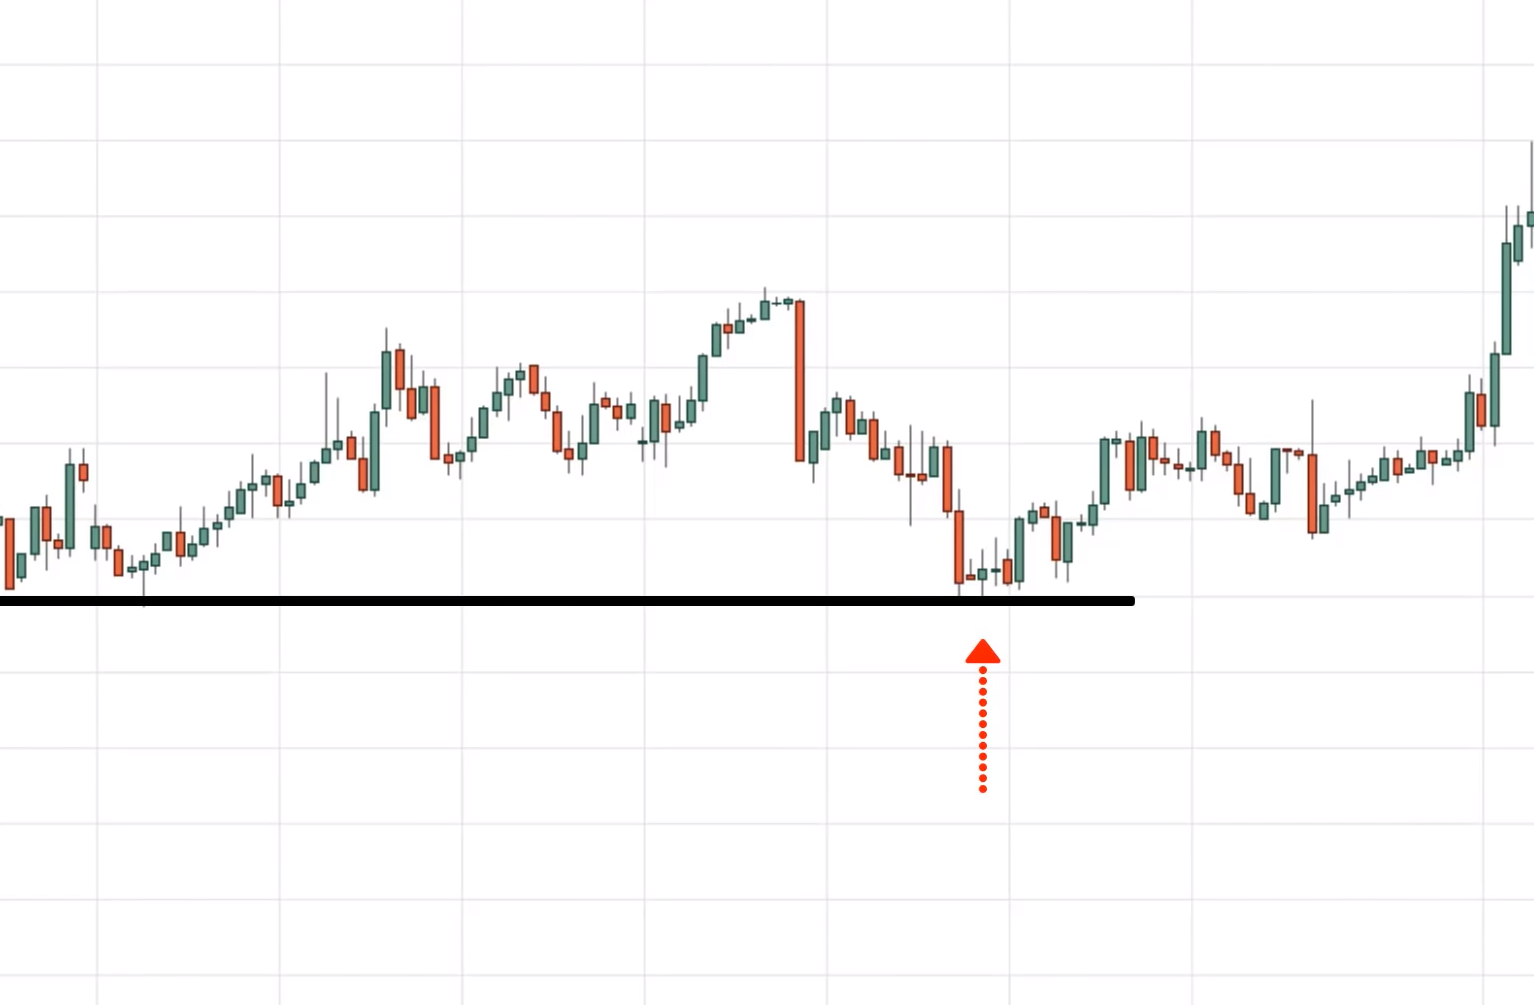
You'll notice that here, the price at this point retest at this area of support on the eight-hour time frame.
One thing to note is that if you look at the higher timeframe by the daily time frame, you know that that area coincides with a higher time frame structure.
Which is the retest of the 50MA over here.
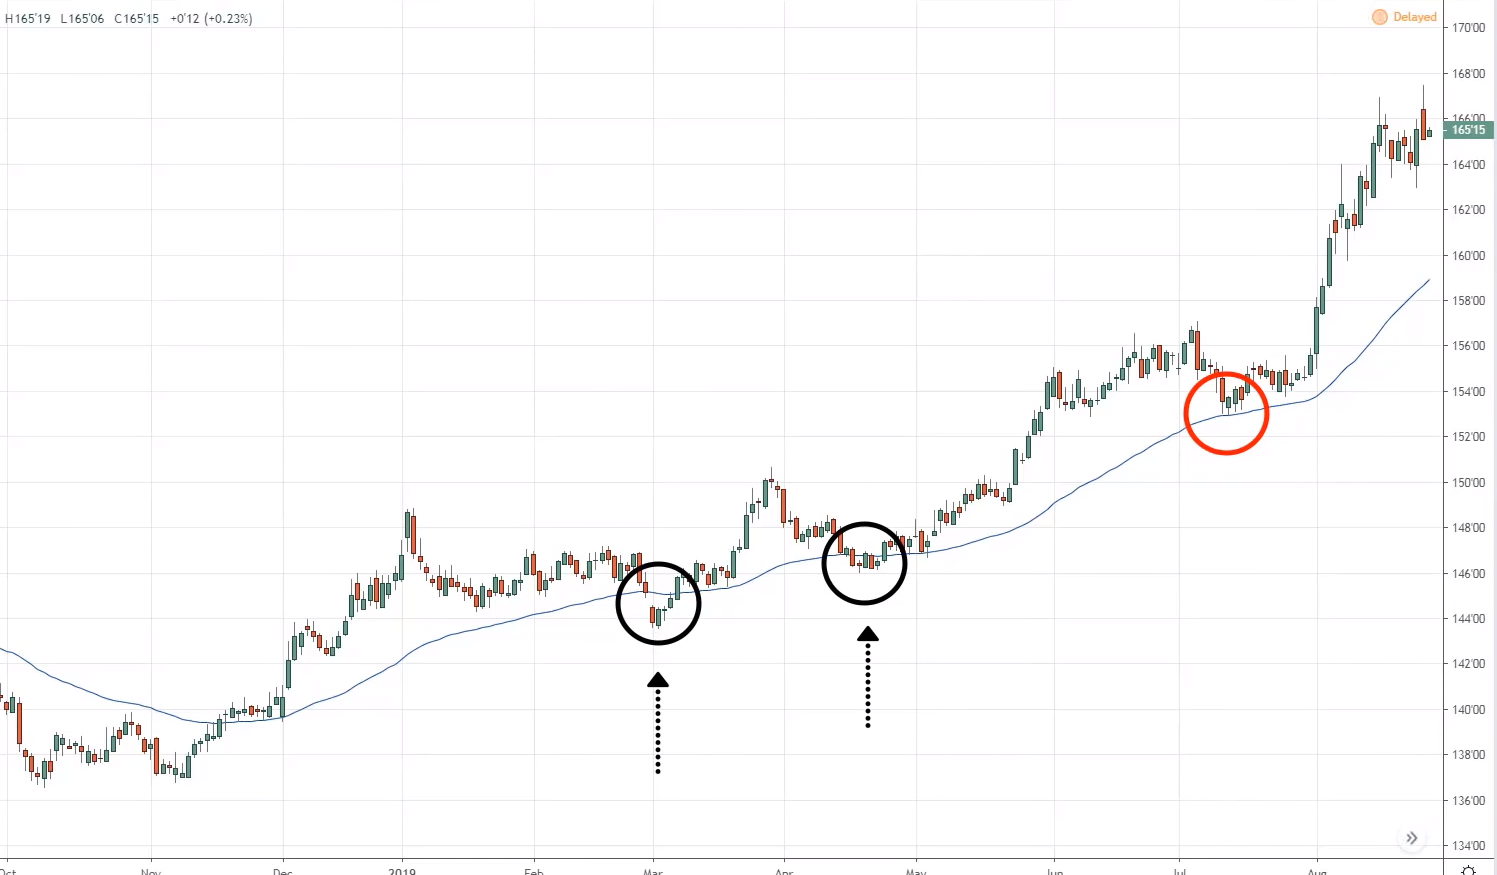
So what you saw earlier there, that retest on the eight-hour time frame was this part over here.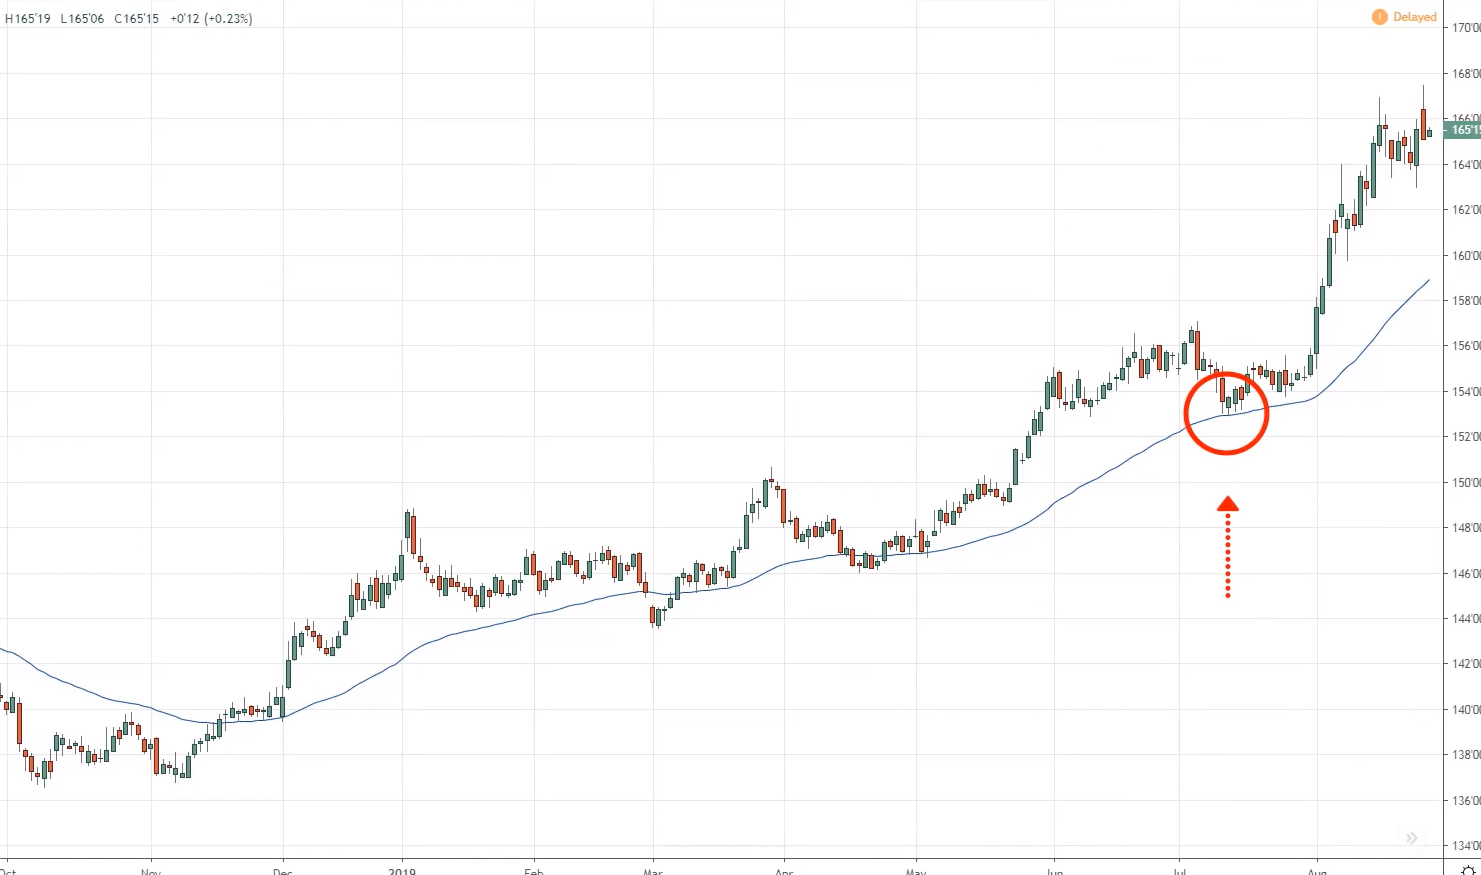
So if you look back, historically, this market tends to respect the 50MA, I tested Once, twice, plus on the lower time frame and eight-hour time frame.
It's in an area of support.
So you can see that multiple factors coming together. An area of support on the lower timeframe is coinciding with higher timeframe support on the market structure.
It could be a trend line, It could be a moving average, It could be support, resistance, whatever.
But as long as there are no areas or levels on the chart, which coincide in between multiple timeframes, that level is enhanced.
That's secret number two I want to share with you. You can get help from the higher time frame, to improve your trade entries.
Because this time around the attention is not just on the lower timeframe traders, but on the higher timeframe traders as well.
They also paying attention to their level, and that could induce enough buying pressure in your favor.
3. Don’t chase big moves, do this instead
Don't chase big moves in the market, do this instead. So here's the thing.
When you look at a chart,
For example, eight years ago when I was trading, I'll look at a chart, and say;
‘’Men!!, look at that bullish momentum, price is so strong, it’s about to rally higher, let me enter the trade, I don’t want to miss the move, let me buy!!!’’
So let me give you an example of, what I'm referring to.
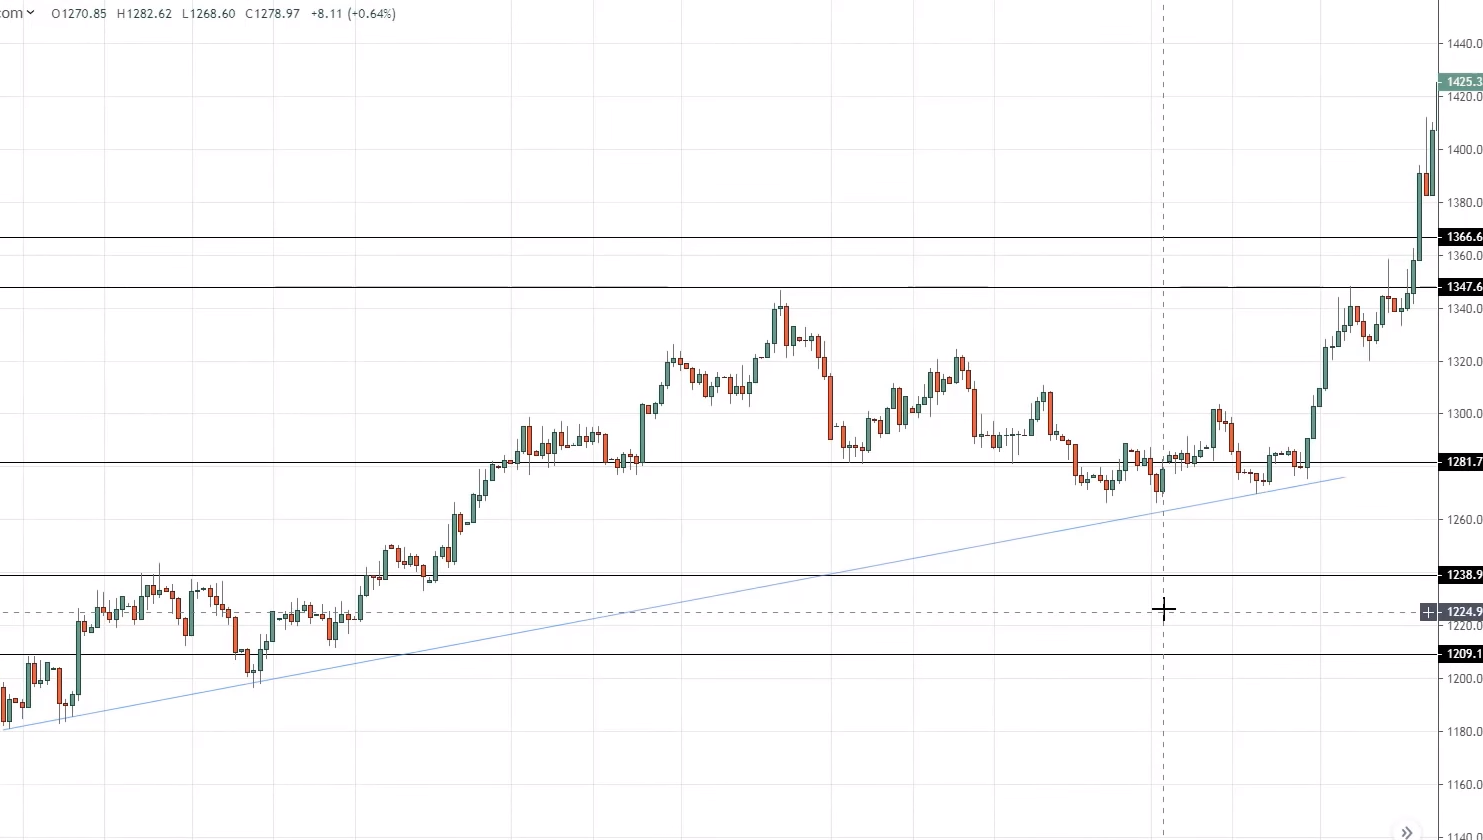
We can see the price now on the daily timeframe. It hasn't broken out, this is so bullish:
Men!!!, Rayner, it's time to buy….
And if you recall right, I shared with you earlier that you wouldn’t want to be trading far from an area of value, you want to be trading near it.
So again, we can see that we are bringing back the same concept you've learned earlier.
And if you think about this, if you were to buy right now at this price, let’s say 1410 price, where is the area of value?
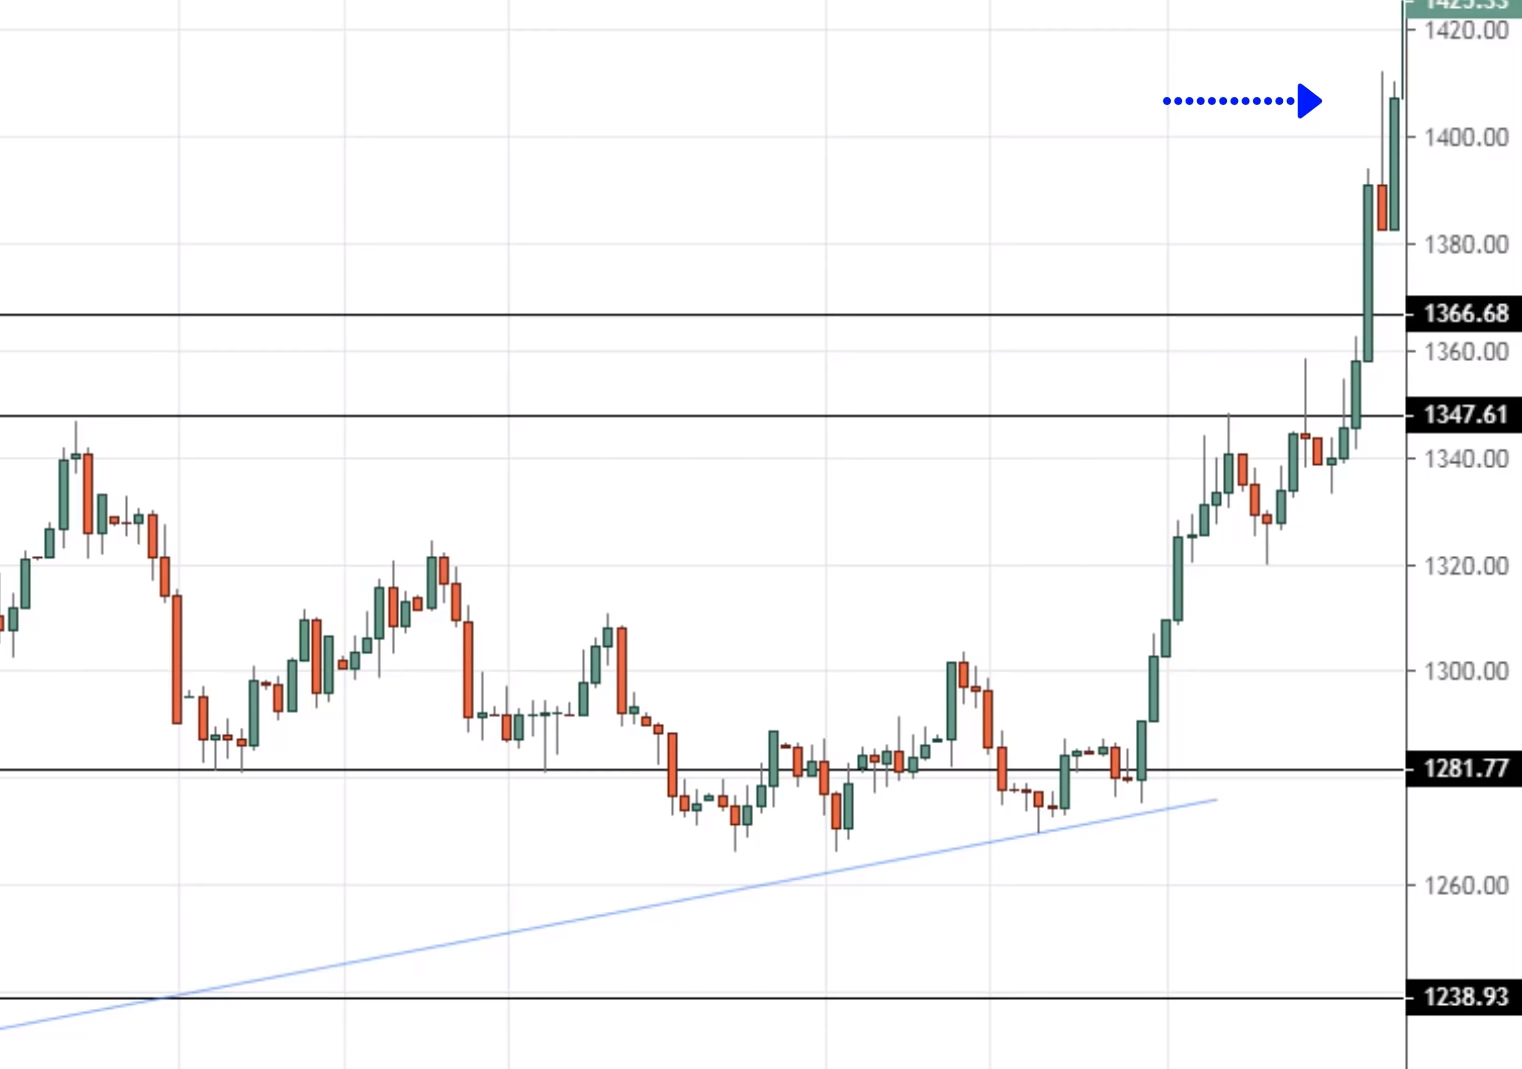
From the looks of this chart, the area of value right now is possibly a previous resistance now support...
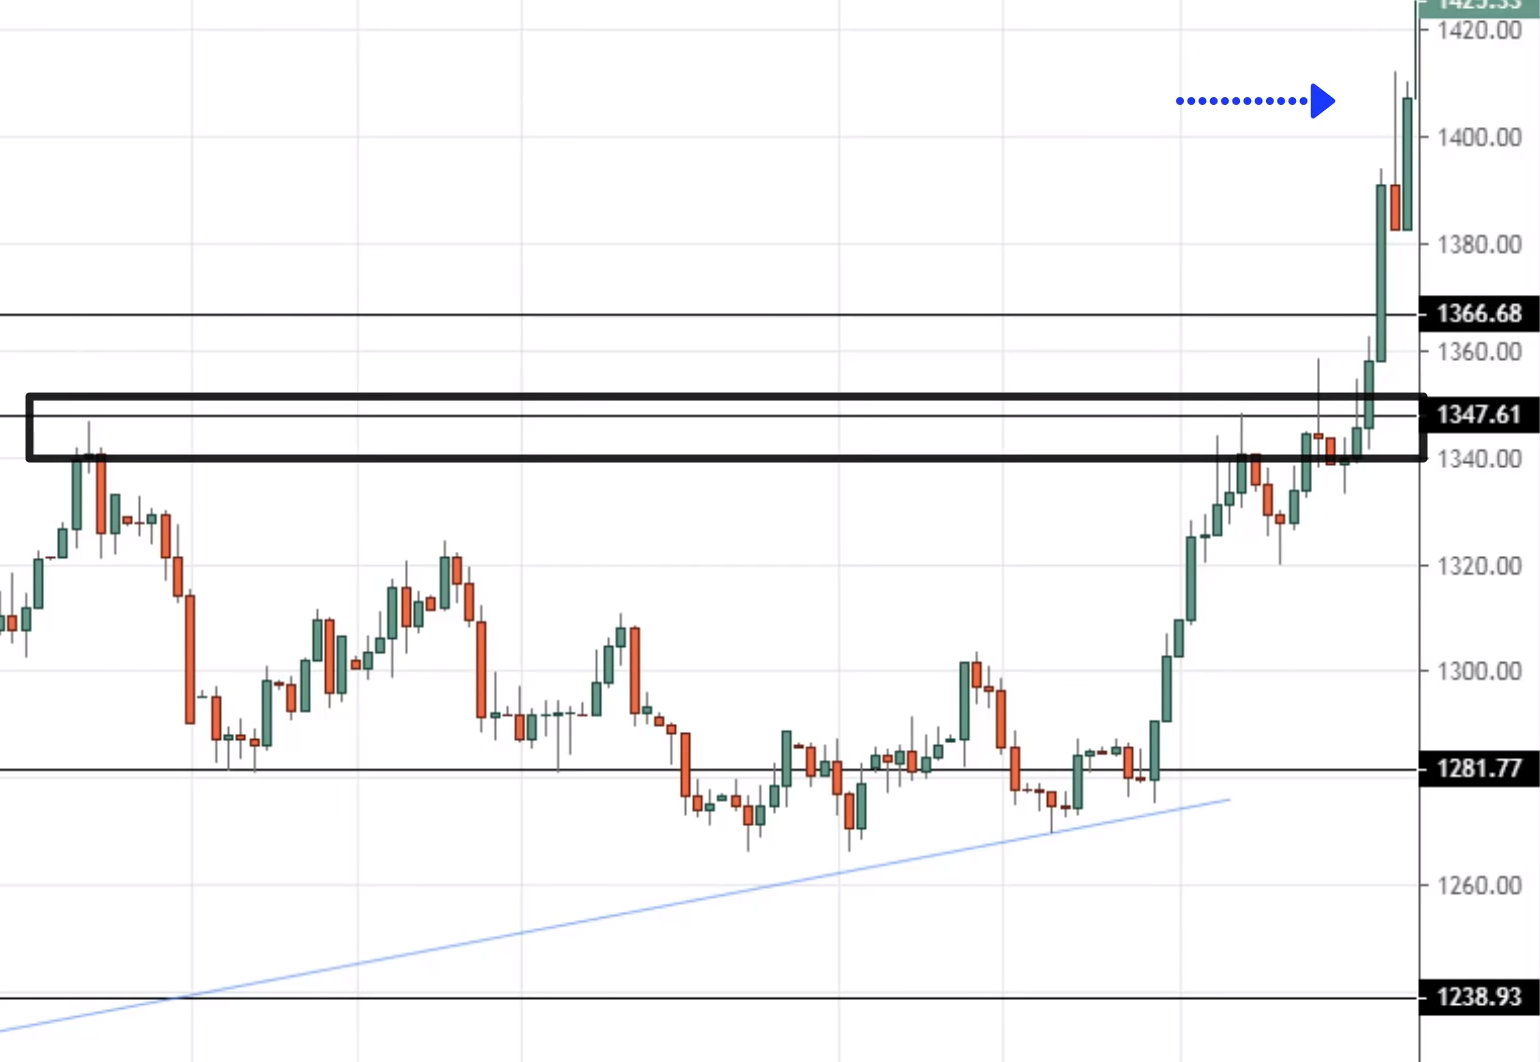
This means that the price could retest back to this area. Previous resistance and support and then continue back up higher that's a good possibility that could happen.
In other words, If you want to set your stop-loss, it is not going to make sense to be putting your stops anyway here, or here.
Because when the pullback comes you will get stopped up. So the logical place will set your stops right, is at least right below this market structure over here.
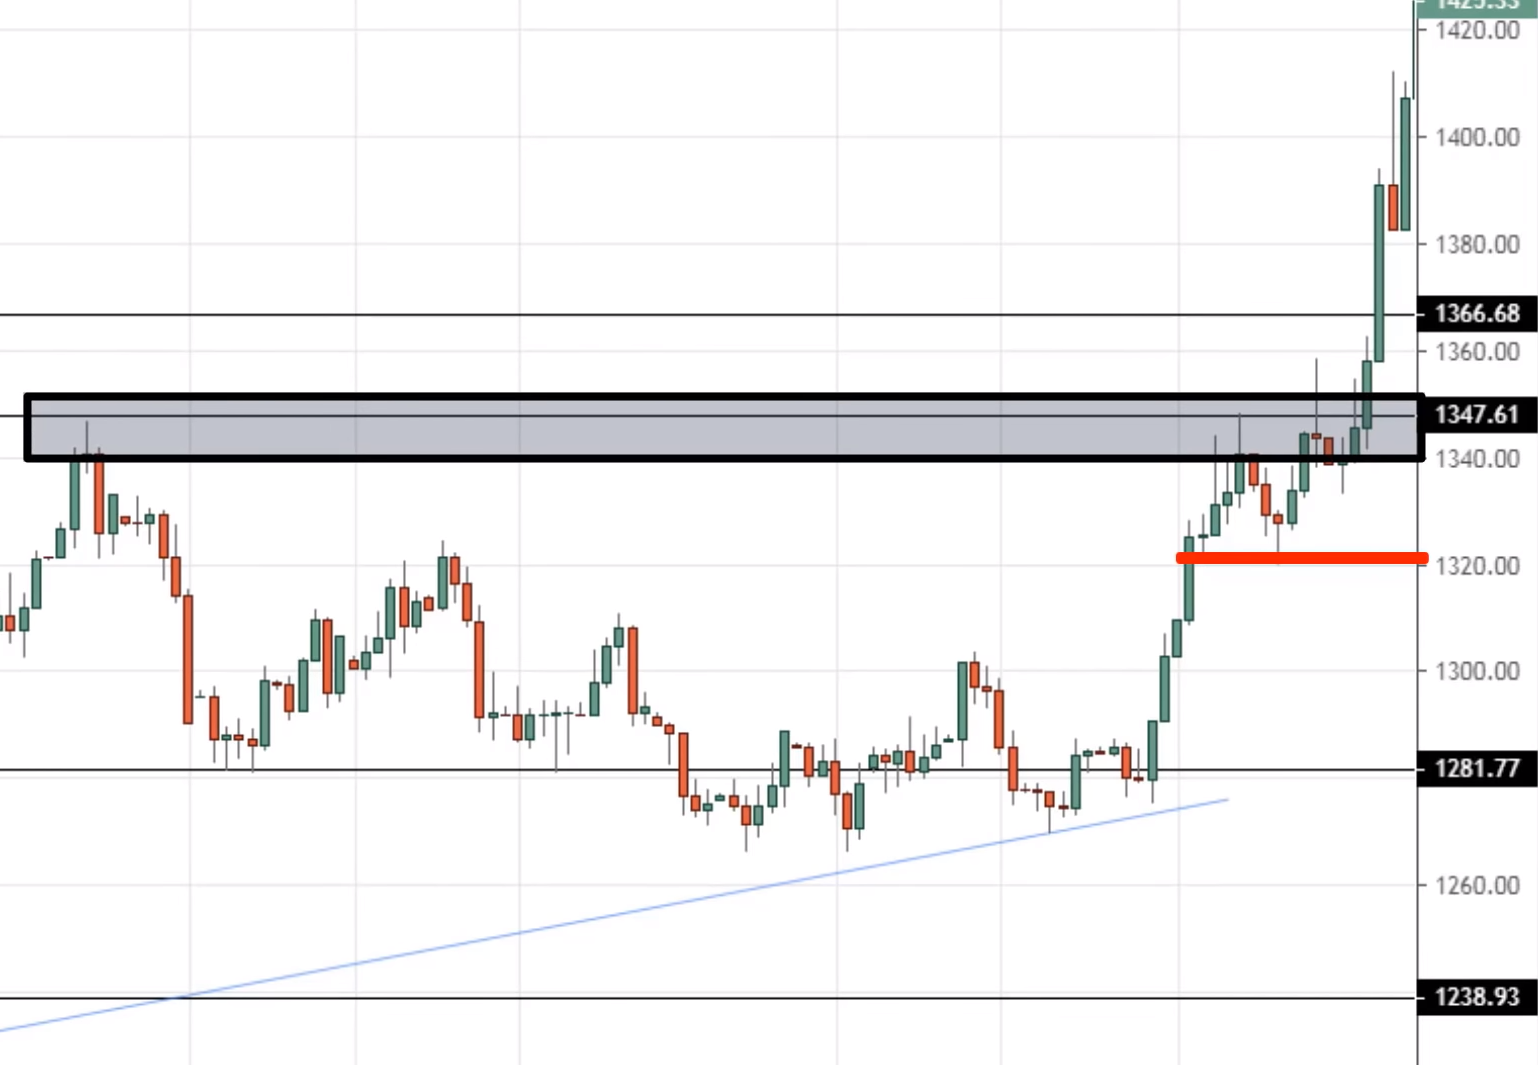
Maybe possibly some way here, right below this market structure.
And you can see right now that if you were to have your stop loss and this so-called proper location with your entry over here, your risk to reward is pretty poor.
So we can see that, if you were to enter with a very lousy stop loss, you're going to get stopped out. If you enter your trade right now with a proper stop loss, your risk to reward is very poor.
So what do you do?
You let the market come to you, don't do anything. Let the market show its head, let it form a new market structure where you can reference and set a proper stop loss.
So this is what I mean by don't chase breakouts do this instead. So what you can do is again, let the market show its heads.
What I usually like to do is to let the market form new market structure, new swing high and swing lows.
Now you have a market structure that you can refer to. You can now reference these lows to set your stop loss.
And another tip that I have for you is that when the market breaks on when it's trending, you want to pay attention to which moving average it’s respecting.
And usually, in a strong trend, it tends to respect the 20-period moving average. So if we just pull out a 20MA, notice that the price seems to be finding support at the 20MA.
You can now have options. You can either use the swing low to set your stop loss, or you can use the 20 periods moving average.
So now when you trade you can still look to buy the highs of this, but your stop loss can now just go below this swing low or below this swing low:
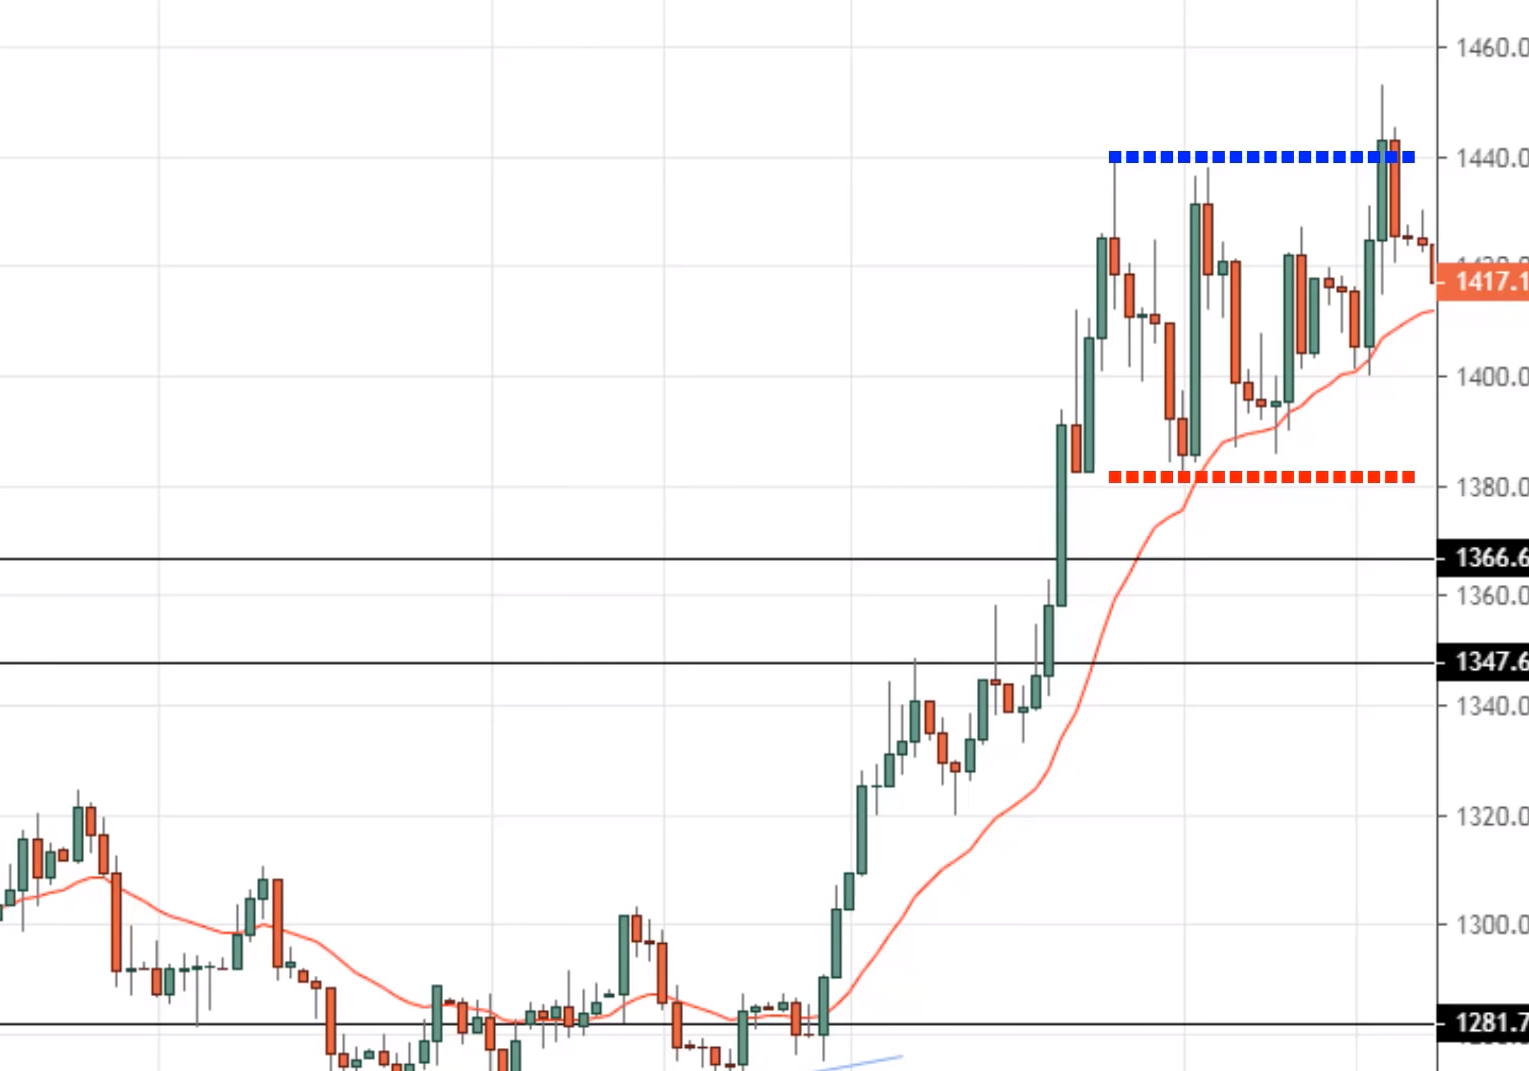
Your stop loss is now much tighter, offering you a much better risk to reward. And if the price were to do a pullback.
You know that this 20 period moving average will serve to support to hold up these higher prices, compared to previously where it wasn't acting as a support.
That price would just retest back this market structure and you get stopped up.
So you can see that if you let the price shows it head trading becomes simpler. So the key thing that if the price makes a huge move or big body candles.
It's usually too late to enter, It’s wiser to take a step back, let the market unfold itself, and then plan your decisions accordingly afterward.
Don't chase breakouts, you can look for a pullback or wait for a new market structure to fall. That's the first thing.
Another thing that you can do that besides chasing breakout is that, look for a build-up to form. So let me explain to you what is a build-up.
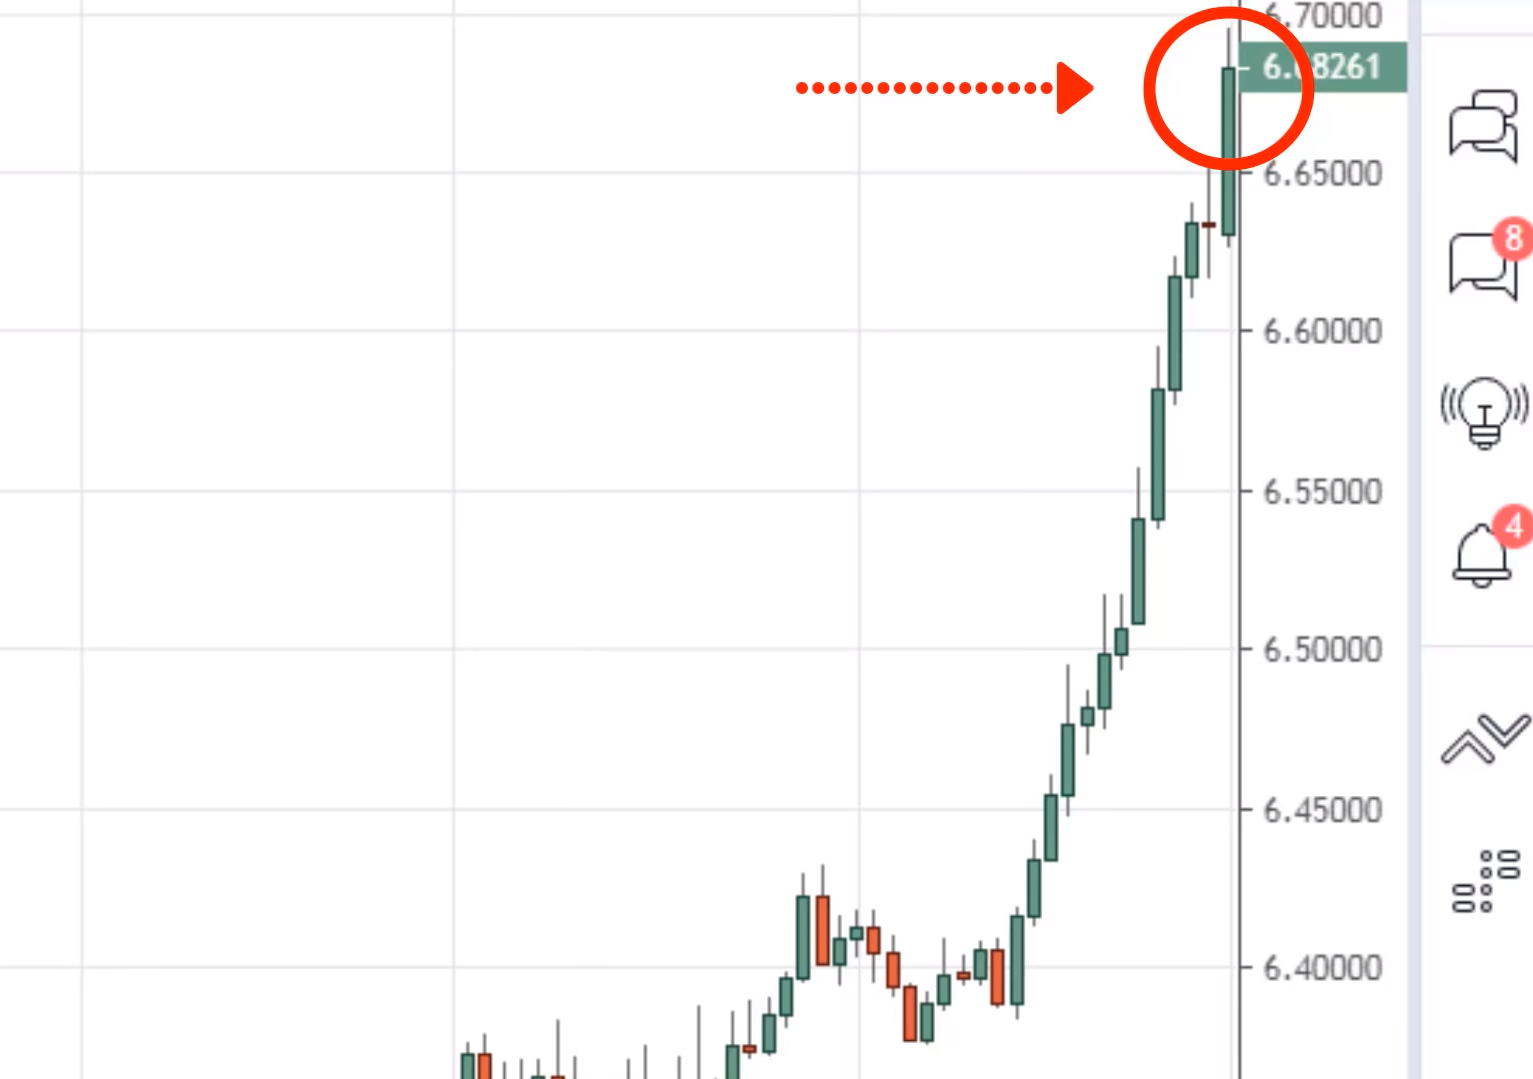
You look at this portion here. This is chasing the market.
When the market is so bullish, candles are big and usually, this is the worst time to buy because as I mentioned.
Poor stop loss placement and chances are you're going to get stopped upon a pullback.
Whenever I look at this chart. I think I look at it right as a form of energy being released.
And when energy is released, it's usually a poor time to enter because all the energy is already out, nothing left in the move.
And when I enter my trades, I want to enter where energy is stored. Potential energy where you know, it's getting squeezed, getting tightness where energy is being stopped and about to be released
You don't want to enter your trades when its energy has already released itself.
You want to enter when energy is being stored. So how do you tell when energy is being stored?
And this is where I mentioned, you want to look for a build-up.
A build-up is essentially a tight consolidation. I like to look for build-up at market structure build-up at support and build up forming its resistance.
Let me show you what is a build up:
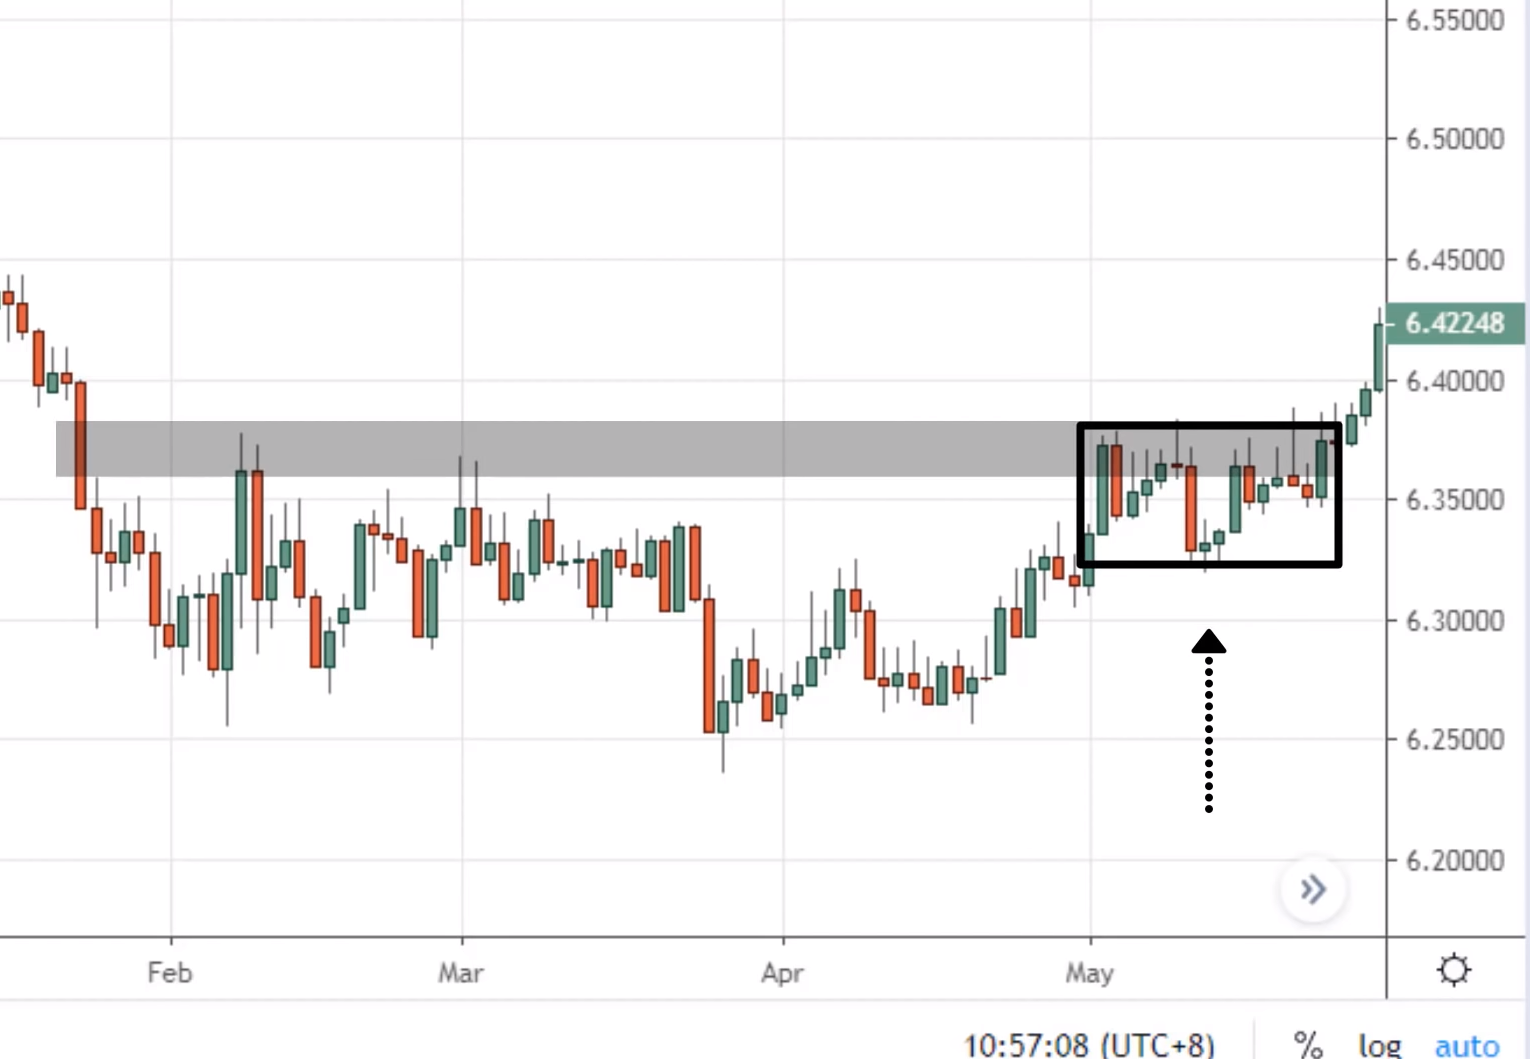
There is this area of resistance over here and there's this tight build up over here. Notice that this price action is so different from the energy days released earlier.
This one with the energies is being stored. It's being constricted, it's being constrained.
It's like ‘’let me out!!!’’.
We can see that this is the containing pattern that you want to look for. A build-up, a tight consolidation, low volatility, whatever you call it.
Just pay attention to this, this is where you want to get interested in buying the breakup.
This is where you know there is a potential for the move to move. And one more tip that I have for you is.
Whenever prices are forming a build-up, the 20MA before the breakup, the 20MA will start supporting the price. It would act as a support.
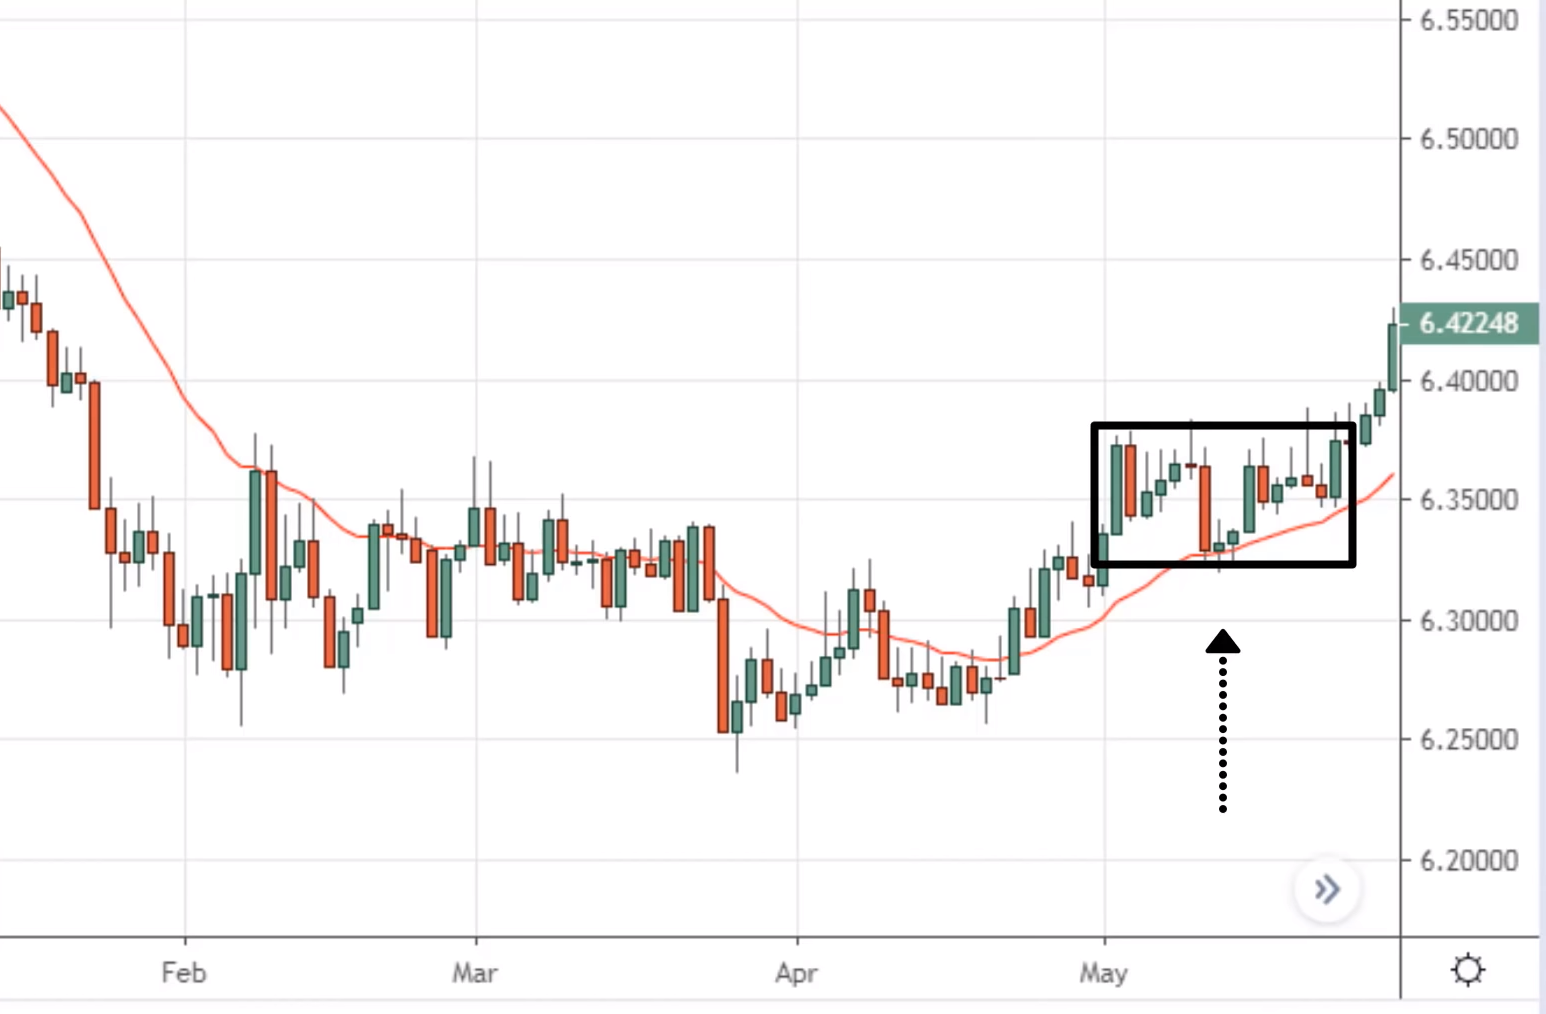
Where the price would tend to bounce off the 20MA, and you notice that phenomenon right over here where the price has to start respecting the 20MA:
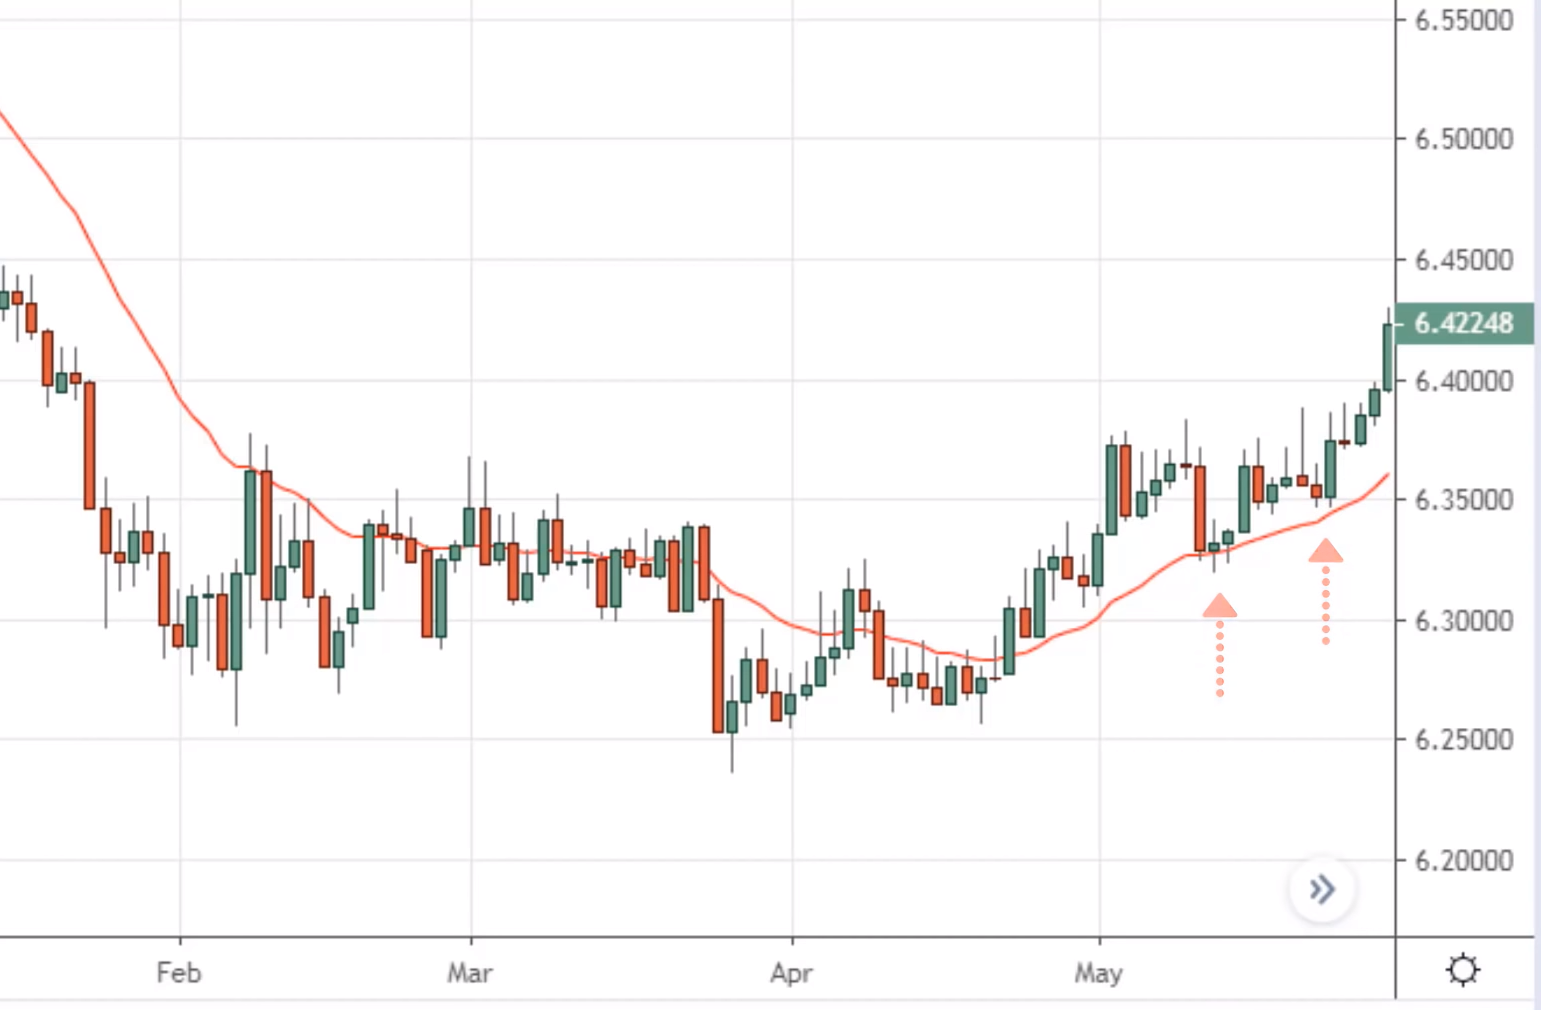
This Is the resistance. This is the build-up that's formed, and when you trade the breakout, do you want to trade break out away from build-up?
And this is the build-up that form...
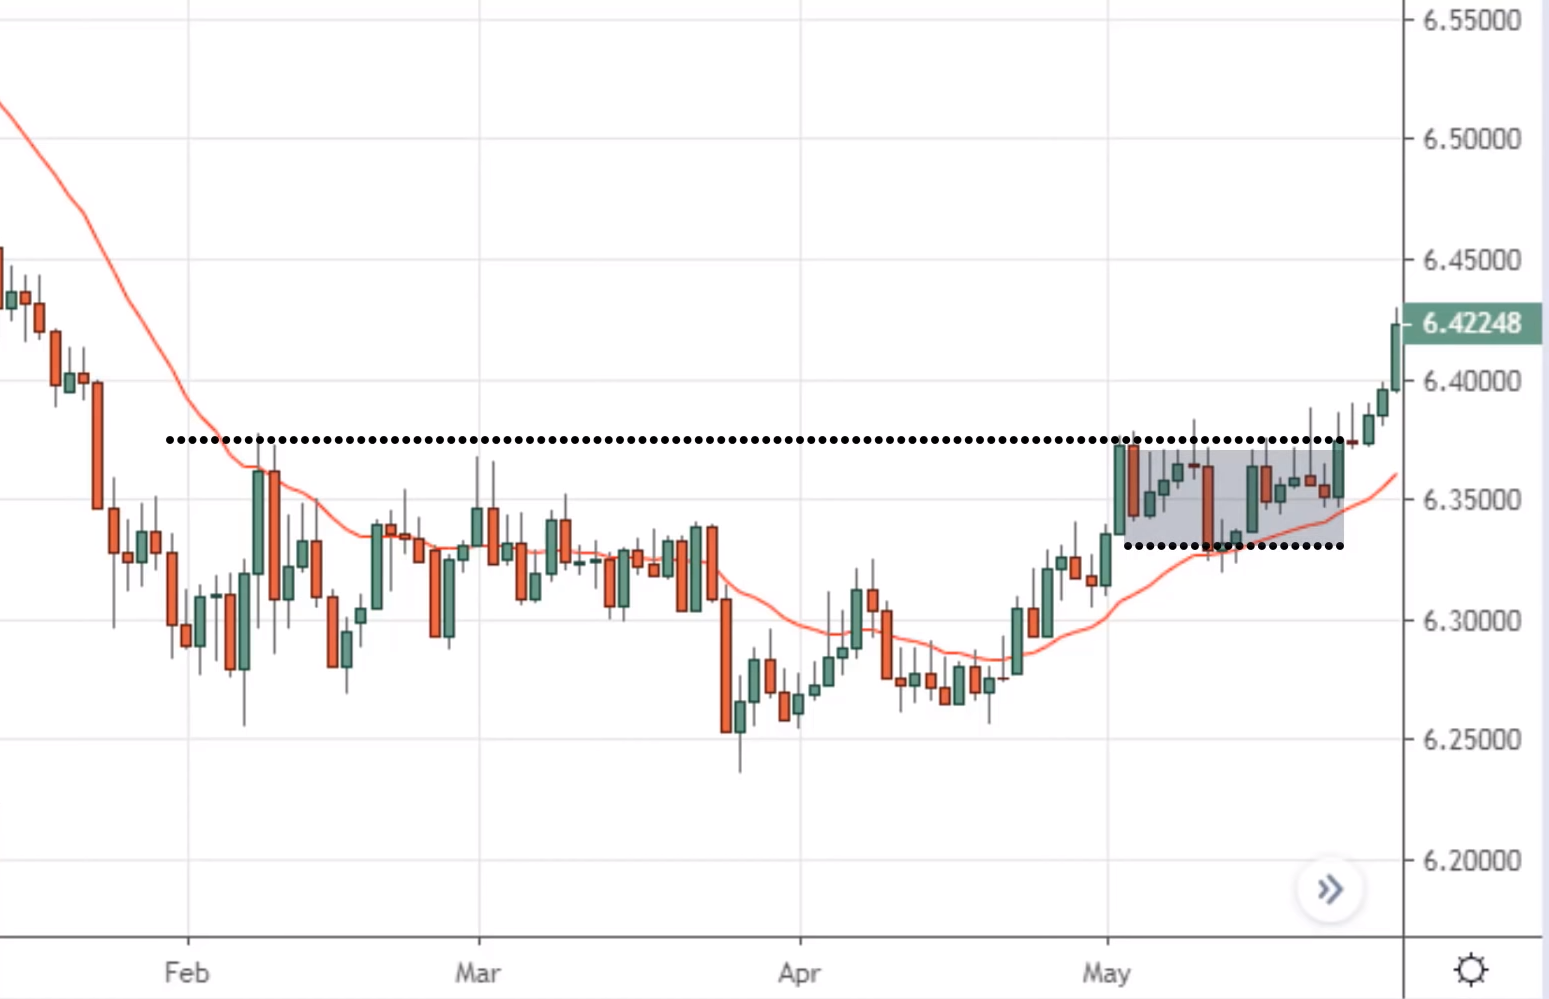
You can have a buy stop order above this high or with our candle close above the highs, whichever you prefer.
Usually, if I see a tight built up, I just have buy stops orders above it. Go out test it and validate it yourself and see whether it’s true.
This is a powerful concept, let me just explain this once again with another example, because this is important. If you look at this, look left.
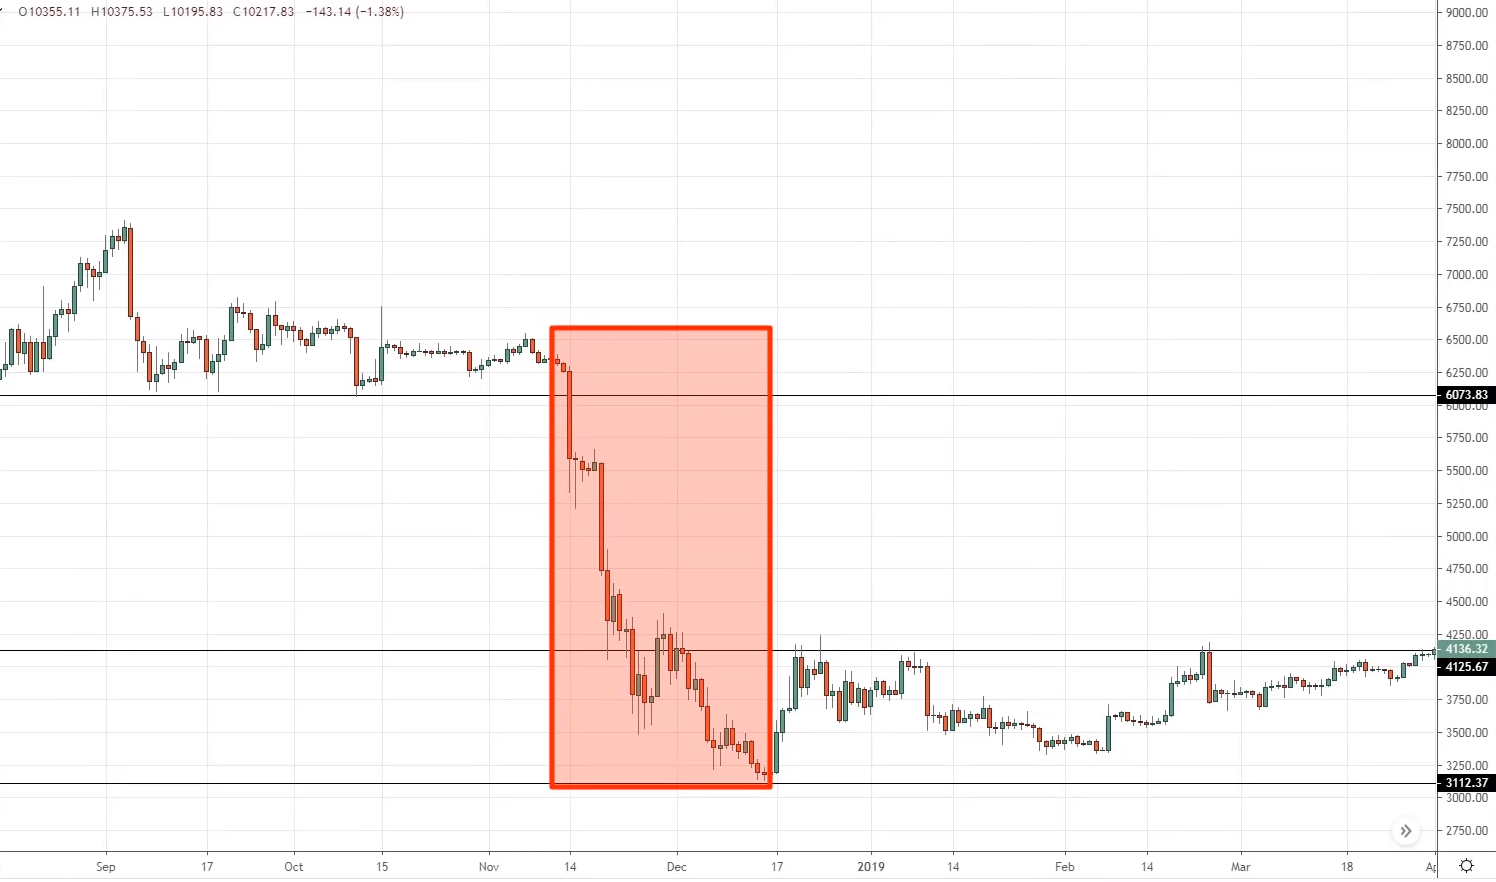
This over here, what is this?
Whenever I look at this chart, to me that is energy being released. And you don't want to enter it when energy has been released because the power, the energy, everything is gone.
Really. It's out. There's nothing left.
You want to enter your trades where energy is being constrained, and you notice over here this price action is so different compared to the one you’ve seen earlier.
This is where energy is being stored, getting constricted, getting tight. It's getting ready to breakout.
And again, a quick tip is the 20MA, usually, the price tends to respect it before the breakout, if it tends to respect it all the more that is like a big plus, you want to be paying attention to the breakout.
Don’t chase big moves, do this instead. Trade the first pullback when a market breaks out. There's a good chance it might make a pullback.
And you can reference the swing high and swing low too, to set your stop loss. Or you can look for a build-up before the price breakout.
That's another thing that you should do. Don't chase big moves into the market because it's usually probably too late to enter.
Recap
- Trade from an area of value, not away from it
- Lean against the higher timeframe market structure
- Don’t chase big moves
- Trade breakouts with build-up or wait for the pullback

