#4: Double Top Chart Pattern
Lesson 4
What is a Double Top
In this video, you’ll learn how to trade the Double Top Chart Pattern.
Here’s what you will learn:
- What is the biggest mistake that traders make when they're trading Double Top, and I want you to avoid this trend.
- How to short the highs of the Double Top with low risk.
- And then I'll discuss when is the best time to trade the breakdown of this chart pattern, and why you want to do so.
- Last but not least, I'll discuss a little-known technique that actually increases the odds of you when you're trading Double Top.
Sounds good, right? Then let's begin…
A big MISTAKE…
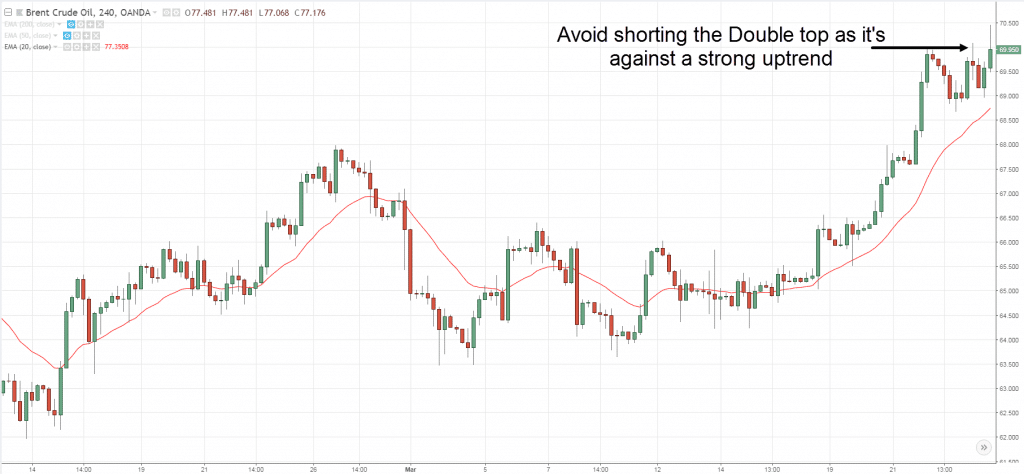
First and foremost, this is the biggest mistake that I see traders make when they are trading Double Top.
For example, you have a nice uptrend.
Then the market forms a potential Double Top over here.
Tested it twice, and they look at this chart, and they say:
"Oh, look at this! This is a Double Top, I better go short because the market is going to reverse towards the downside."
Just because they see these two-pointed nipples, doesn’t mean that the market's going to reverse!
Here’s what I mean:
Chances are the trend has been in motion for months or even years!
Now, think about this logically.
What makes you think just because you see two pointed nipples that form over four weeks, five weeks, you think the market is going to reverse to the downside?
Does it make sense?
Something that has been in motion for months and even years would just reverse on a dime?
In fact, don't take my word for it.
Look at this quote by Jesse Livermore:

What does it mean?
It simply means that a trend doesn't simply reverse on a dime.
Sure, it happens time to time but more often than not, when a trend reverses, it takes time for it to play out itself.
The market will go into a range for quite a long period of time to wash out the weak hands, and then slowly it shows signs of crack and then it will reverse.
Don't just blindly trade Double Tops.
Be aware of the duration that it takes to form.
If it's forming too quickly, chances are the trend will just resume itself.
Moving on…
How to short the highs of the Double Top
There's a very simple trading technique or strategy that you can use to short the highs of Double Top.
Let's say that the market is again in an uptrend, comes down, then retest back towards the high.
You don't want to just simply place a sell limit on there and think that the market will form a Double Top.
No, you want to let the market show its hand to you, reveal its hand before you take a trade.
Because if you think about this...
If you were to just blindly short over the second top, where are you going to put your stop loss?
In the middle of nowhere?
Doesn't make sense!
Why not let the market reveal its hand to you before you put on a trade!
How does this market reveal itself to you?
Very simply...
Wait for the market to come up higher and then get rejected and close lower.
This is a form of price rejection.
Yes, you are trading against a trend, but at least now you have a point of reference to set your stop loss.
And there's a possibility that with this market, we're possibly retesting back the swing low with a little bit of meat for you to capture.
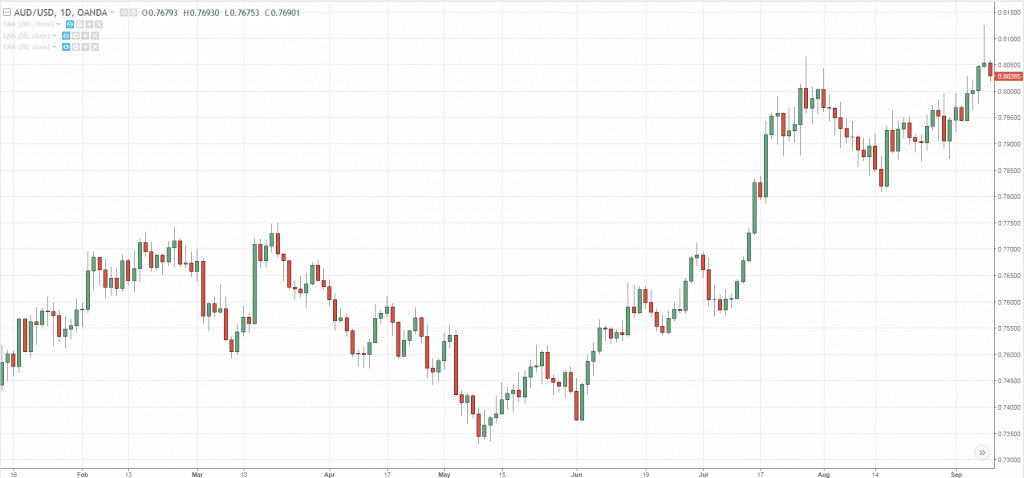
Here's an example on the AUD/USD:
You can see that this is a potential Double Top.
And you've got a price rejection sticking out of these highs.
That becomes a point of reference.
You can actually look to short this market, set your stops above the high of the price rejection and see if the market can retest back the swing low!
Of course, now you're clearly trading against a trend...
You want to be more aggressive with your trade management.
So, if the market shows signs of reversal that the trend is about to continue itself.
You want to bail out of the trade quickly.
This is the type of trade that is more of a hit-and-run.
You want to see if the market can quickly come downward.
If it doesn't, you're out of the trade.
That's it.
And this is how you go about shorting at the highs of Double Top.
You wait for the market to show its hand by forming a reversal candlestick pattern, like shooting star, engulfing pattern, et cetera.
Moving on…
When is the best time to short the breakdown of the Double Top
Let's talk about how most traders would do it...
They see a Double Top, then it comes down, breaks this so-called neckline or support, and go short.
It's not wrong, but if you think about this…
Where are you going to put your stop loss?
Chances are you would put it all the way above the top.
It's going to be pretty darn wide to have a large stop loss when you're trading the Double Top.
Also, quite often what you'll see is that you see a strong momentum move coming into an area of support.
The market could just as well reverse swiftly back towards the upside.
And you pretty much realize that, "hey, I got short in the lows, man. I feel like an idiot!"
What's the solution to this?
Well, it's very simple...
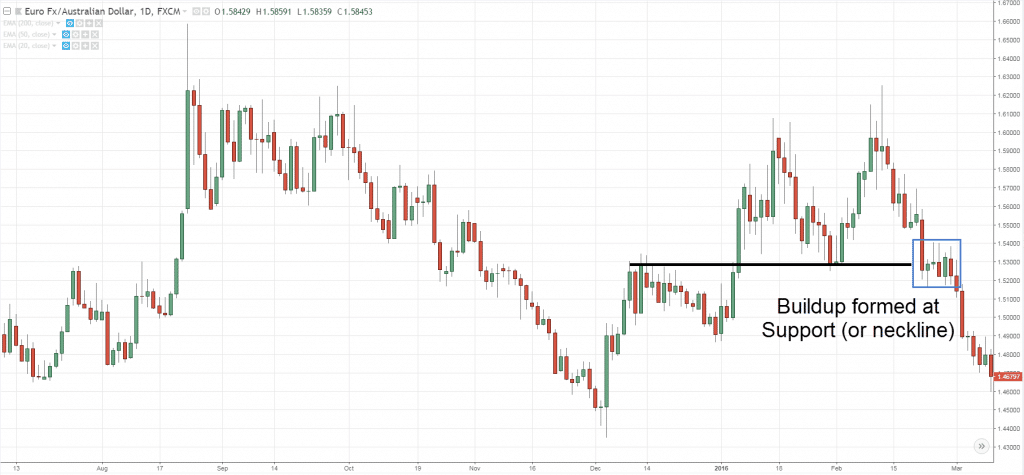
You want to wait for a build-up to form its support.
What is a build up?
A build-up is simply this:
The market forms a Double Top, then it comes down to the low of support.
Give it some time to consolidate near the lows of support.
This is what I call a build-up.
It looks something like a coil, a very tight contraction.
Volatility has shrunk, so the range of the candle would be smaller than usual.
When you see this pattern, this will now make sense.
Why is that?
Because you can use this as a point of reference to set your stop loss, instead of setting above the highs.
If the market breaks down of this build up you can just simply set your stop loss above the minor swing high, maybe just above it.
Now, your stop loss has a shorter distance, compared to your original one where you place it above the tops.
Which is the one that you want to trade?
Chances are, for me, I always go with this set up with a build-up, a tighter stop loss.
And when volatility contracts it tends to expand afterward.
So, if you ask me, it's better to trade this particular technique.
Instead of watching the market swing into support, having a larger stop loss, and then with the possibility that it could just swing back in the opposite direction.
Usually, when you have a build-up, other traders will long would have their stop loss below the low, and that increases the odds of the trade working out.
Because if the market trades lower, it triggers this cluster of stop loss, which induce further selling pressure.
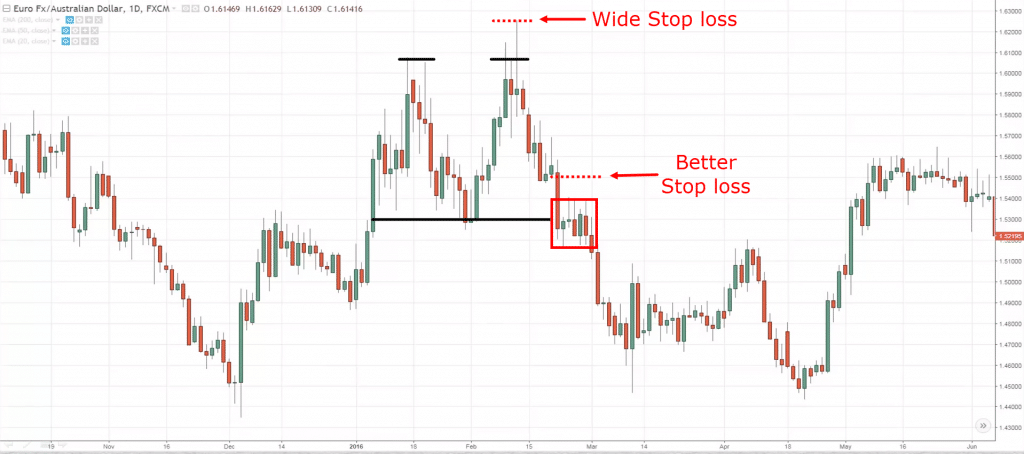
Just to share with you another quick example here:
As you can see over here, this is the Double Top I mentioned.
No worries if you missed shorting the highs.
Because when the market came towards the area of support, notice that it formed a nice tight build up as I mentioned earlier.
And this could be a point of reference to set your stop loss above the build-up.
Instead of setting above the highs, which is above the second top.
So notice your stop loss is much tighter, a build-up would actually induce further selling pressure when it hits below the lows, as traders who are long would get stopped out of their trade!
Okay, so this is an example.
Moving on…
How to increase your odds trading the Double Top
This is a really, really simple technique.
Traditionally, if you read textbooks, courses, and stuff like that...
They say that the Double Top would happen in an uptrend to signal the end of the uptrend.
But if you think about this…
Why must you only trade this particular pattern in an uptrend?
Why can't you trade the Double Top in a downtrend?
Wouldn't that increase the odds of your trade, because now you have the trend at the back of your trade?
You're trading with a trend, you're trading with a path of least resistance!
Wouldn't that improve the odds of your trade?
You can actually apply the same two techniques that I shared with you earlier with the trend!
For example, the trend is down, you get a Double Top, you can look to short the price rejection of the highs as what I mentioned earlier.
You can look to short the price rejection of these highs, and this time around you can even now be more confident in your trade and hold it longer.
Because you're trading with a trend and possibly the market.
You could actually capture a nice move towards the downside!
Alternatively, I'll also mention that you can short the breakdown similarly in a downtrend.
Let's say you have a Double Top, and the market forms a buildup.
You can actually look to short the breakdown of the area of support as well!
You can see, what I have just shared with you...
You can further improve the odds or the probability of your trade when you're trading with the trend!
Some of you may argue, "Oh, no Rayner, Double Top only exists in an uptrend blah, blah, blah.”
I would say don't get too fixated on what is right or wrong.
When you're trading, when you're dealing with technical analysis, you have to think about the logic to what you're doing.
Don't just blindly follow what books, courses, or gurus tell you.
In fact, don't even take what I tell you in this video at face value.
Go and test out the approach, the techniques to what I've just said.
Go and verify to see what I've said really makes sense and really works or not!
alright?
With that said, let's do a quick recap…
Recap
- Don't blindly trade Double Tops, especially when Double Tops take only a few days or few weeks to form, and the trend prior to it has been in motion for months or years.
- You can short at the highs of Double Tops using reversal candlestick patterns, like shooting star, engulfing patterns etc.
- Look to trade a break of support when there's buildup form.
- You can trade the Double Top with the trend. It will further increase the probability of your trade working out.
With that said, I have come to the end of this video.
Any feedback or questions, just let me know


