Here’s the deal:
I’m not a chart pattern trader.
However…
I LOVE trading the Ascending Triangle chart pattern.
Why?
Because when other traders get stopped out, they help “push” the market further in your favor.
In short, you PROFIT from the stop orders of losing traders — and that’s why it works.
Clearly, this is a powerful chart pattern if traded correctly.
That’s why I’ve created an entire blog post on how to trade the Ascending Triangle step by step.
You’ll learn:
- What is an Ascending Triangle and how does it work
- Don’t make this mistake when trading the Ascending Triangle (that most traders never realize)
- How to better time your entries using one of these 3 techniques…
- How to set your stop loss so you don’t get stopped out before the market moves in your favor
- When to exit your winning trades for maximum profits
Or if you prefer…
You can watch this training video below:
What is an Ascending Triangle chart pattern and why does it work
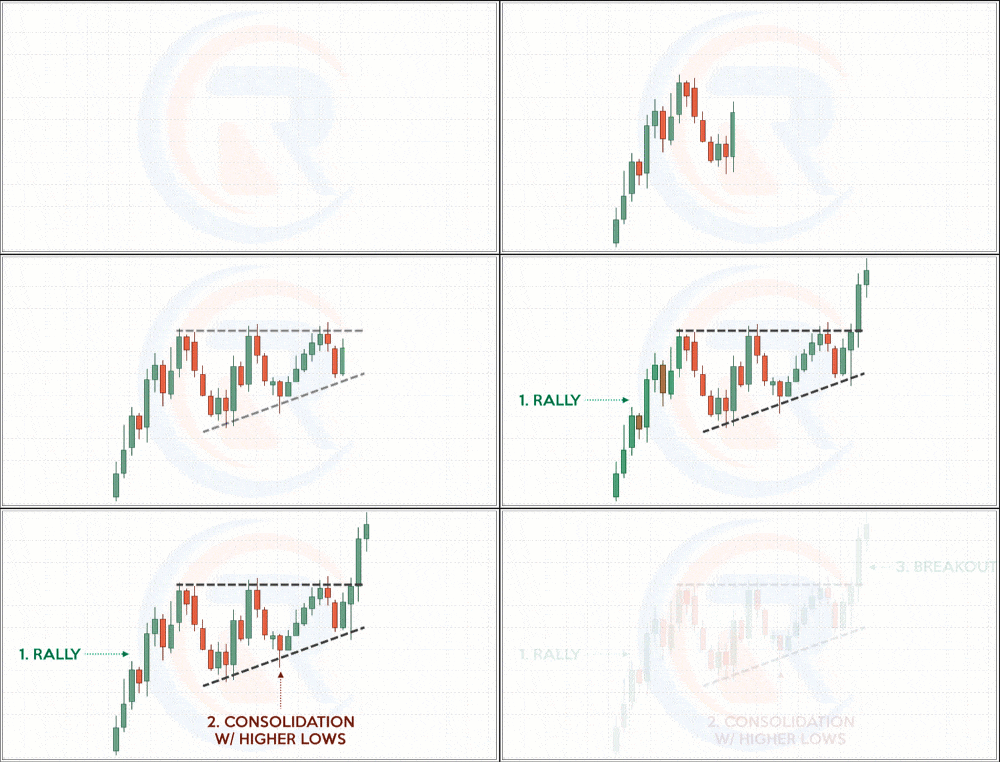
The Ascending Triangle is a bullish chart pattern that signals the market is about to head higher.
Here’s how it looks like:
As you can see, the Ascending Triangle has a series of higher lows approaching Resistance.
This is a sign of strength for 3 possible reasons:
- The buyers are willing to buy at higher prices
- There is lack of selling pressure
- Buy stop orders are clustered above Resistance
I’ll explain…
1. The buyers are willing to buy at higher prices
Here’s the deal:
If the buyers are not willing to buy at higher prices, you won’t see higher lows coming into Resistance.
The fact the market can form a series of higher lows tells you that there is demand even as the price continues higher.
2. There is lack of selling pressure
Now if there’s strong selling pressure, the price shouldn’t remain at Resistance for long. Instead, it should move lower quickly.
But, if the price is still hovering near Resistance, it means there’s lack of selling pressure even though it’s at an “attractive” level.
3. Buy stop orders are clustered above Resistance
And that’s not all…
Because as the price re-test Resistance, more traders will look to short the market and place their stop loss above Resistance.
But what if the market breaks out higher?
Well, these buy stop orders will be triggered and it fuels further price advance.
Pro Tip:
The Ascending Triangle is one of the three triangle chart patterns out there.
The other two are the Descending Triangle Pattern and Symmetrical Triangle Pattern.
Now before you trade the Ascending Triangle chart pattern…
Don’t make this common mistake when trading the Ascending Triangle chart pattern (that most traders never realize)
Now according to most ascending triangle trading textbooks, they’ll tell you to go short when the price is at Resistance, right?
But here’s the deal…
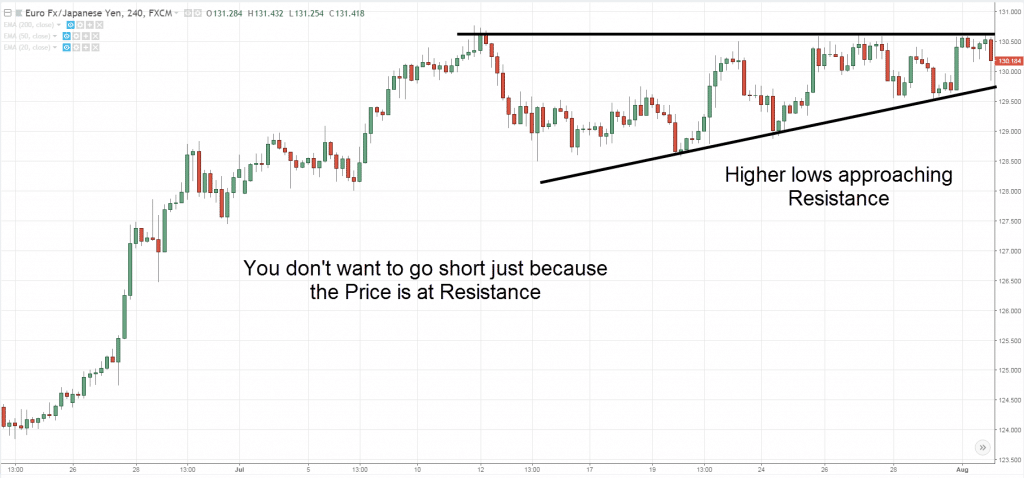
Not every Resistance level is meant for shorting because you must watch how the price approaches it.
Here’s an example…
Let me ask you…
Is this a good time to go short?
No.
Because you’ve learned that higher lows coming into Resistance (an Ascending Triangle) is a sign of strength.
This means the market is likely to breakout higher. And the last thing you’d want to do is go short.
Does it make sense?
Great!
Because in the next section, you’ll learn when is the best time to enter a trade when trading the Ascending Triangle chart pattern.
How to time better time your entry using 1 of these 3 techniques
There are 3 ways to do it:
- Stop order
- Break and close
- Re-test of trendline
Let me explain…
Let me explain how to trade ascending triangle…
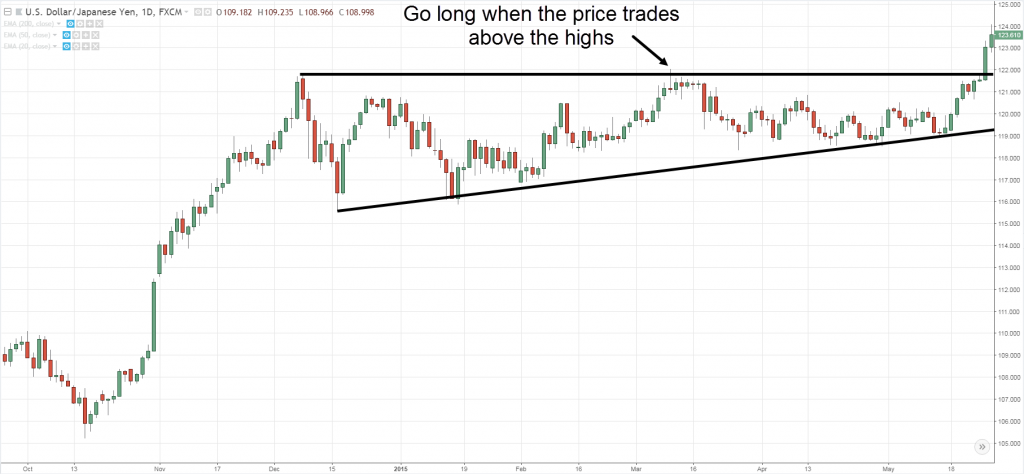
1. Stop order
This approach goes long when the price trades above the highs of the Ascending Triangle.
All you need to do is place a buy stop order and you’ll immediately be long when the price trades above the highs.
An example:
Pros: This is one of the best prices to enter if the breakout is real.
Cons: It might be a false breakout.
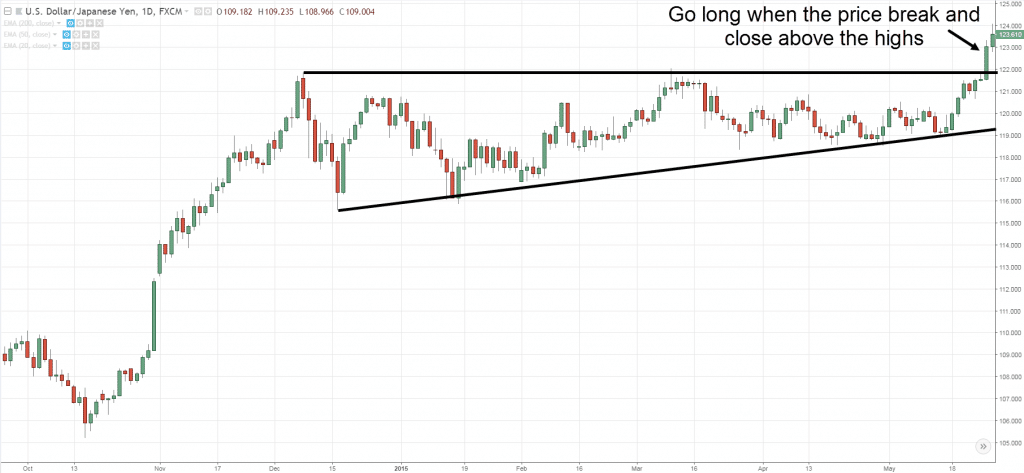
2. Break and close
This is similar to the previous approach.
The only difference is you wait for the price to break and close above the highs.
Here’s what I mean:
Pros: It reduces the likelihood of a false breakout.
Cons: If the momentum is strong, you’ll enter your trade at a much higher price.
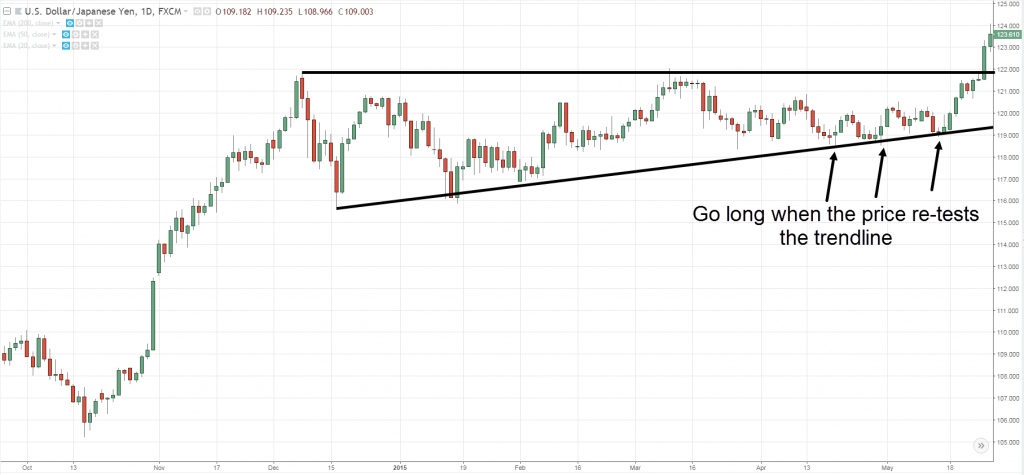
3. Re-test of trendline
If you’re an advanced trader, you can even enter the breakout before the breakout.
How?
By going long when the price re-tests the trendline (of the Ascending Triangle).
An example:
Pros: Favorable risk to reward on your trade if the market does break out.
Cons: The market might not breakout.
This is great stuff, right?
Now you know exactly how to trade ascending triangle!
However, that’s not all because in the next section…
You’ll learn how to set a proper stop loss because the last thing you want is to get stopped out of your trade only to watch the market breaks out higher.
Read on…
How to set a proper stop loss so you don’t get stopped out “too early”
Now it doesn’t matter whether you’re trading the Ascending Triangle, breakouts, pullbacks, and etc. because the concept is the same.
Your stop loss must be at a location where if reached, will invalidate your trading setup.
This means if the market hits stop loss, you automatically know you are wrong.
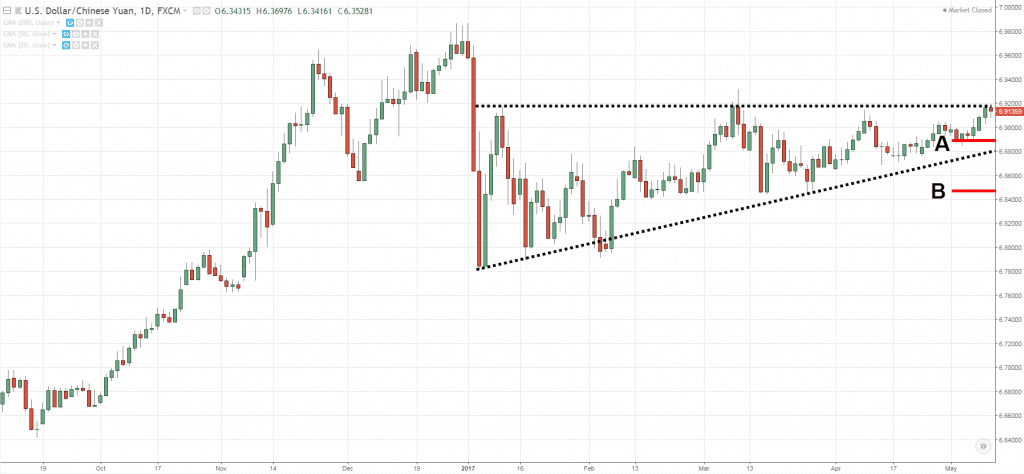
So look at the chart below and ask yourself…
Where should you put your stop loss?
A – This isn’t a good level as the price is within the Ascending Triangle
B – This is an ideal place to set your stop loss because if the market reaches it, you know the Ascending Triangle pattern is “destroyed”.
Moving on…
Where to exit your winning trades for maximum profits
So…
You’ve identified an Ascending Triangle chart pattern.
You long the breakout and the market moves in your favor.
Now you’re wondering:
“How do I exit winners?”
Well, here are 2 techniques you can consider:
- Trailing stop loss
- Price projection
I’ll explain…
1. Trailing stop loss
The idea of a trailing stop loss is this…
You’ve no idea how long the trend will last. So you trail your stop loss and “lock-in” your gains as the market moves in your favor.
So how do you trail your stop loss?
Well, you can use an indicator like Moving Average.
Here’s how:
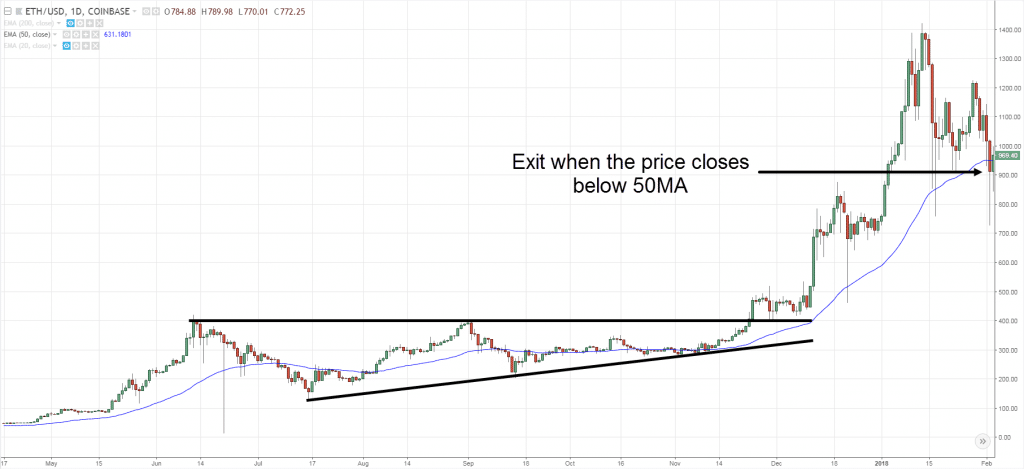
If you are long, then you can trail your stop loss using the 50-period moving average.
This means you’ll hold your position until the market breaks and close below the 50-period moving average.
Here’s what I mean…
Some of you might be wondering:
“But why the 50-period moving average?”
Look:
There’s nothing magical about the 50-period moving average.
A better question is to ask is…
“What type of trends do I want to capture?”
For long-term trend, you can use the 200-period moving average.
For short-term trend, you can use the 20-period moving average.
Now if this technique is not for you, then you can check out…
2. Price projection
This is a classical charting principle technique to project where the price will exhaust itself.
It can be used on chart patterns like Ascending Triangle, Head & Shoulders, Double Bottom, and etc.
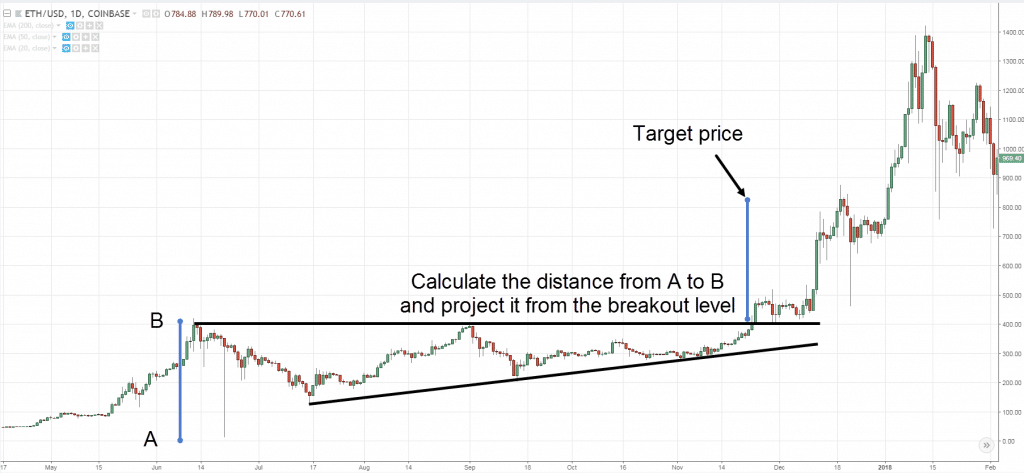
So here’s how it works for an Ascending Triangle chart pattern:
- Calculate the width of the Ascending Triangle (from the high to low)
- Add this amount to the breakout level and that’s your price projection
An example…
But…
One of the issue with price projection is the market can almost hit your target profit, and only to do a sudden reversal.
Sometimes, it can even reversal all the way back and hit your stop loss.
So, what should you do?
Trailing stop loss and price projection combo
Well, you can combine both techniques!
This means if the market moves in your favor but it hasn’t reached your price projection level, you can utilize a moving average to “lock in” your open profits.
So, even if it does a sudden reversal, you still “protect” what you have and not give everything back to the market.
Frequently asked questions
#1: What should I do if the ascending triangle is forming against the trend?
I would caution against going long because after all, that would be trading against the direction of the trend. I would expect the market to breakdown lower and so I’ll look for trading opportunities on the short side.
#2: Can I use the ascending triangle pattern for both trend continuation and trend reversal?
Yes, you can. But for trend reversals, you want to have a longer duration for the ascending triangle pattern to form, ideally 100 candles.
Conclusion
So here’s what you’ve learned today:
- The Ascending Triangle is a powerful chart pattern that exploits the stop loss of losing traders
- Don’t short the market if you spot an Ascending Triangle because the market is likely to move higher
- You can time your entries by using a buy stop order, waiting for a break and close, or a re-test of trendline
- Your stop loss should be placed at a level where if the market reaches it, the Ascending Triangle chart pattern will be “destroyed”
- You can exit your winning trades using a trailing stop loss, price projection, or a combination of both
Now here’s my question for you…
Do you trade the Ascending Triangle chart pattern? Why or why not?
Leave a comment below and share your thoughts with me.


Great post!
I do and have traded the ascending triangle for quite a while now. One of the first patterns I learned. Currently looking at WPX on the weekly chart forming an ascending triangle.
Thank you, Troy!
Hi Rayner, Great post! Would you please post about descending triangle as week? Thanks in advance.
Hey Rahul
The descending triangle is simply the opposite of the ascending triangle.
This was one of the first patterns I learned about. It’s great isn’t it, because you can really see the buying pressure building up like a coiled spring! So easy to spot and take advantage of. Thanks as always, Rayner!
You’re welcome, Mike!
This goes for descending & symmetric triangles as well right? I don’t want to assume that you’re also high on these 2 triangles patterns as well since you didn’t mention them. Thanks!
The descending triangle is the opposite of an ascending triangle.
As for the symmetrical triangle, it’s more of a trend continuation pattern.
Hi Rayner, Great explanation and I really like your trading strategies, glad to read all your posts. Wondering what if the trend is against the triangle direction. Would you please take the example for this. Thank you so much
I’ll probably skip it unless it’s in a possible accumulation stage.
Really excited reading your post Its detailed and most encouraging for all categories of traders.I Really wish to know you better and receive trades setup. Thanks Rayner
You’re welcome!
I am looking for perameters to make a screen for cup and handle and acendi g triangle…anyone know where I can find it?
Not that I know of…
Not what I expected. That’s what I call a wedge, one of the corrective triangle patterns. An ascending triangle is a trending pattern with a constricting channel.
Always best to trade out of the corrective pattern, as you describe, unless there is enough range to offer a trade within the pattern. Many times we are trading within very large patterns such as this that we don’t even see.
Thank you for sharing 🙂
Great!!! =) learning!
Hi Rayner, thank you for your sharing, indeed I have learnt a lot and enjoy reading. You had so far simplified your theory with chart and is easy to understand and follow. However could you show chart to explain ” Trailing stop loss and price projection combo” technique, for this I have difficulty to understand.
Thank you.
I’ll look into it…
yeah, i also don’t really get the nuance of that. I’m reading that as “have a sell order at both a price projection AND below the EMA” ….. so doesn’t that just mean always have a stop loss under the EMA if you’re going long?
I think we’re both overthinking it tho, i think he was just saying, psychologically, you can trade with a goal in mind (price projection) and/or an exit plan (prevent loss). I think both are good, personally. bc exiting at the price projection prevents you from getting too greedy and missing your profits, and having the stop loss protects you from revenge hodling…inverse greed “i don’t wanna lose on this, let me hodl a bit longer!”
greed kills, and complacency (not cutting your losses) kills too.
haha i just realized your comment is two years old…i assume you’ve figured this out by now lmao
TLDR; thanks rayner! I love your channel! I always recommend you to traders of all levels! especially beginners. you were the first person who really grabbed and kept my attention. a huge deal in this space, as there’s such a big barrier to entry where lots of ppl teaching themselves think it’s way harder than it is bc it seems so complicated at first
Sir, I am big fan of you & I like your style to teach all lessons in simple way. I have two questions.
1) It is used as a continuation pattern or reversal pattern.
2) which time period is best in which ascending triangle created, I mean 1 to 3 months or 1 to 6 months.
1. It can be used as both actually. For reversal you want it to have a longer duration compared to trend continuation
2. The longer the duration, the more significant it is.
I hv but I didn’t notice how you hv to trade it, so thanks for this technique. I will ensure that today onwards I follow the instructions so that I can be on the business. Thanks again
Awesome, let me know how it works out for you bud.
Love the information you bring.
My pleasure!
Yes will trade
Hi Rayner. Thanks a lot for sharing the knowledge. How about ascending triangle in downtrend? Please educate. I tried to post a relevant screenshot here but unable to do.
I wrote a post on it here… https://www.tradingwithrayner.com/descending-triangle/
this is a descending triangle. I mean ascending triangle in a downtrend.
Hello, Rayner,
How to set the trailing stop in the MT4 platform?
Very very educating stuff . Your lecturing is so simple and understanding and love to read every bit of your publication materials. God bless you and keep up the good works
Glad to help out!
I am glad knowing that assending trading chart pattern so very much thanks sir.
I have never traded this pattern but I can now. Nice explanations
You’re most welcome!
I am still at the beginning stages of learning to trade. Please I will be highly grateful if you can advise me on the best tim frame for a beginner. I can easily understand these patterns on 1 minute time frame, but the higher the time frame, the more it’s confusing to read or see the patterns.
Sir can you give me pull back book as pdf and I’ll pay the money
Amazin Ray, Thanks for that.
Can you please create a tutorial for ascending wage and descending wages to and its reason behind breakouts.
Amazing work man. I cant describe in words how amazing you are!
Hi Elias,
Thank you!
Hi Rayner,
Isn’t it better to trade the ascending triangle in combination with increased volume? Any other indicators we should use when trading the ascending triangle?
Thank you very much sir for sharing your knowledge
I am mew in trader and I am learning these topics are very helpful for me. Thank you so much sir, Rayner.
Hey Saveed,
Check out the academy…
https://www.tradingwithrayner.com/academy/
Hello rayner,
I have a very interesting question for you regarding this topic. Well let’s say am seeing a descending triangle pattern which is formed near the support and suprisingly near the 200-EMA for a daily time frame. Is it possible for a break down. The price is above the 200EMA in the the higher time frame(weekly).
Kindly let me know what you think.
And the share price seems to be in a distribution phase right now.
Is it the same concept “VCP pattern” of minervini?
hi rayner
i have one doubt how to find prebreakout in triangle(ascending,decending, symentrical) pattern any clues there .
thank you my guru
[…] Tip: This is known as an Ascending Triangle chart pattern (and the inverse is Descending […]