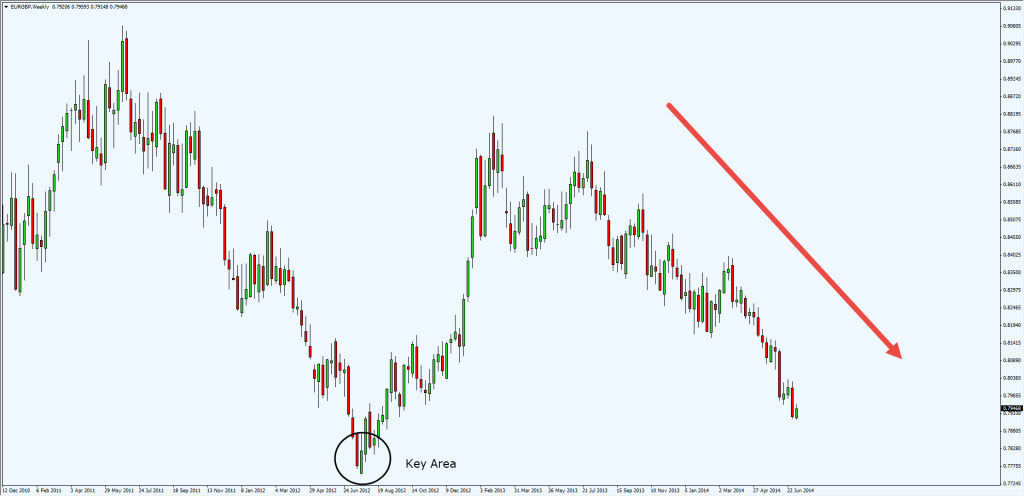
The EURGBP Weekly Chart:
The weekly chart shows that this pair’s momentum is to the downside. It has another 180 pips more before approaching the key area.
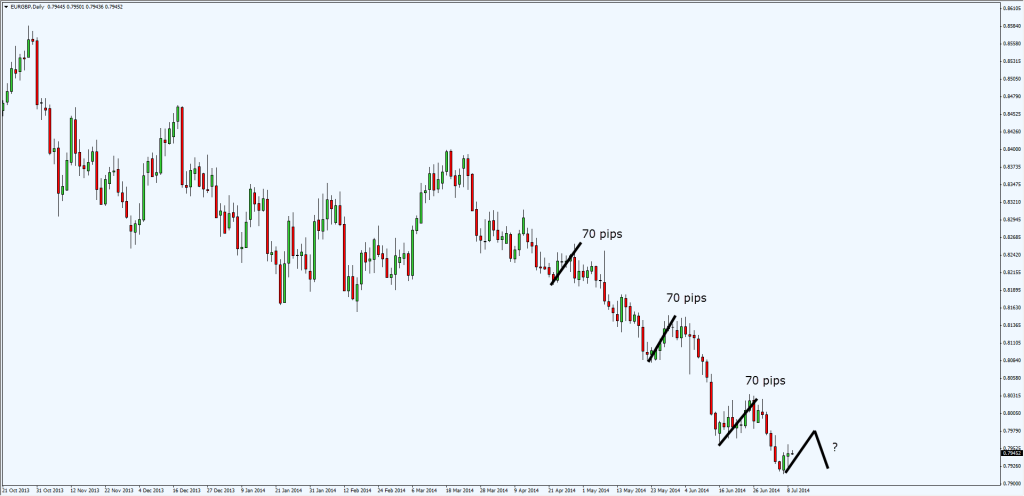
The Daily Chart:
The daily chart you’d notice price likes to retrace about 70 pips before heading lower. Thus I’m expecting a similar move again.
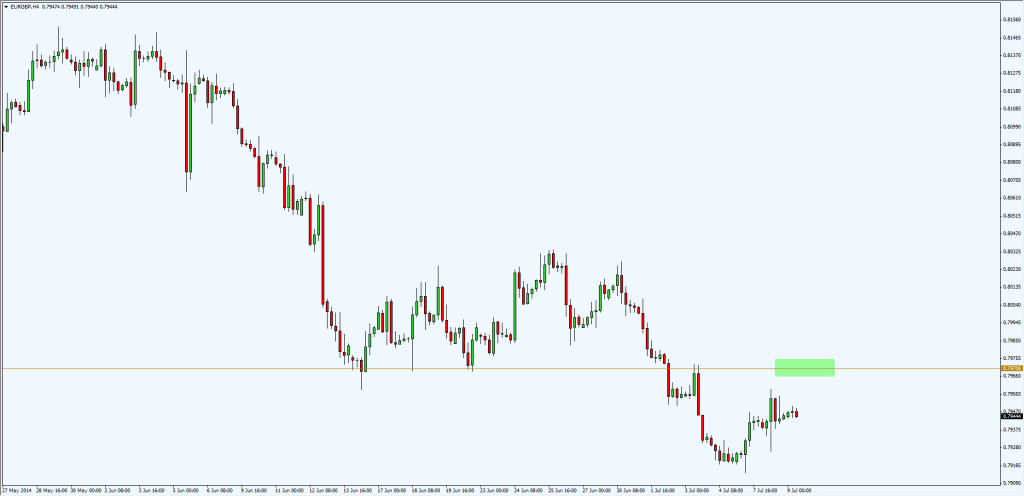
The 4-hours Chart:
The 4-hour chart shows previous support turned resistance at the green area.
Look to short at the green area with a stop loss of 25 pips.
Take half at the swing low at around 0.7920 and the remaining half to ride.


