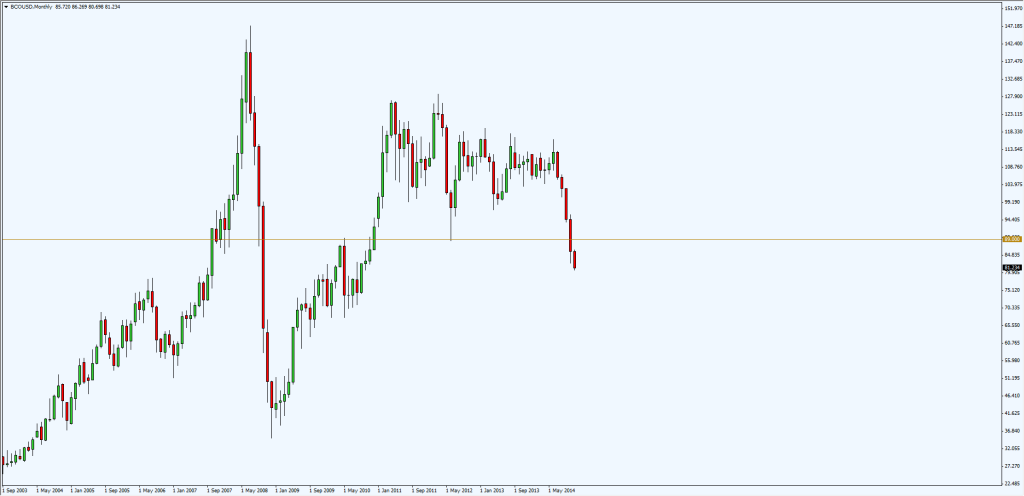
Monthly Crude Oil Progress Chart:
This is the monthly chart of Crude Oil. It has fallen 5 months in a row and recently broke the support at 89.
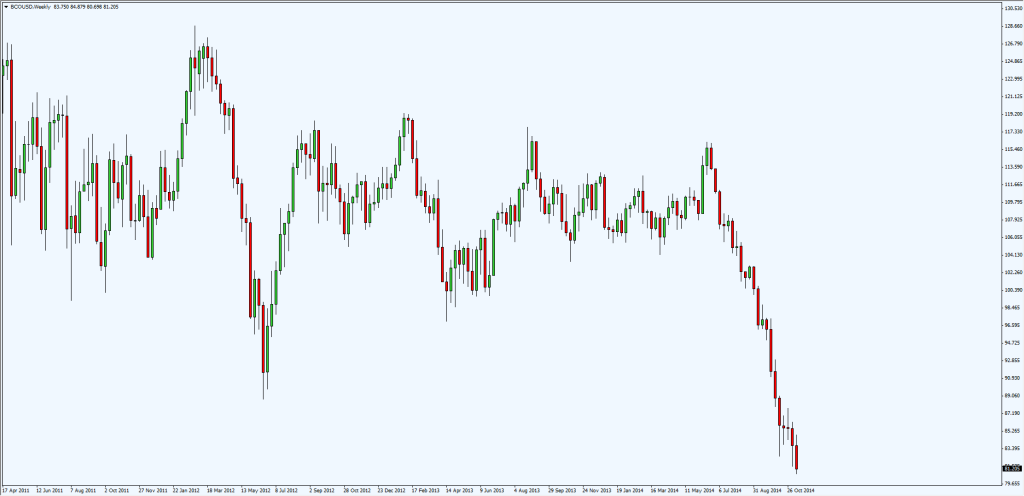
The Weekly Progress Chart:
On weekly, we see a steep parabolic move towards the downside with no end in sight.
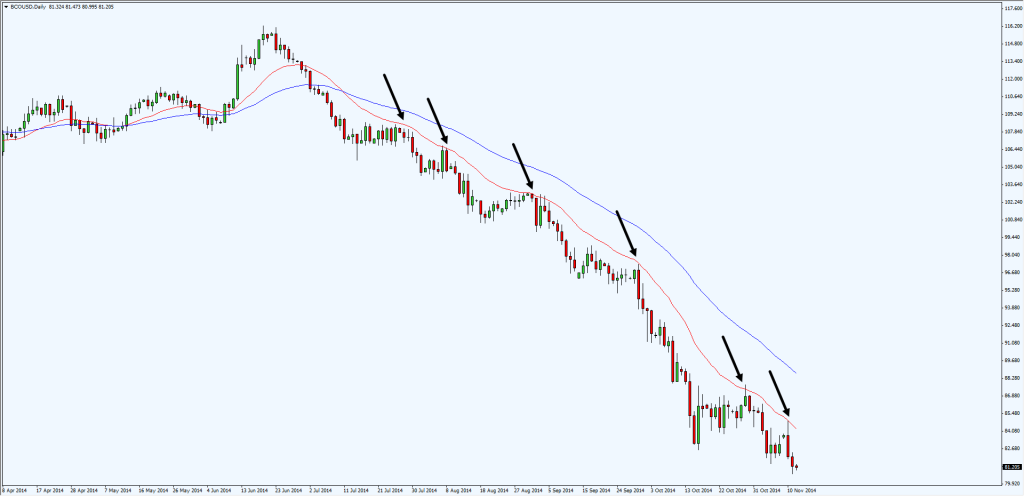
The Daily Progress Chart:
In the daily chart, we notice that price tends to bounce off the 20 EMA.
Traders can consider shorting on a pullback or look to trade breakout to the downside.
Good Trading!


